Beef –The Inefficiency of Too Much Fat
The UK's Levy Board estimates £339 million was paid to farmers in 2010 for fat trim, a waste product. 4 March 2014
 7 minute read

The figure works off a 10 per cent trim of 898,000 T of dressed beef and veal (Defra 2010) and appears in an English Beef and Lamb Executive study Understanding the Inefficiency of Too Much Fat.
Rainer Roehe, Colin Morgan and Andrew Clarkson investigated the issue after 13.6 per cent of beef carcasses and 23.3 per cent of lamb carcasses were 'over-fat' in 2010.
Introduction
Fat trim increases as the animal ages and gains weight, writes the EBLEX team. Fat is a late-maturing tissue and most of its development happens after bone and muscle. According to the findings of the review, this can be influenced by breed, sex, diet and age.
Breed can influence fat weight, location and rate of deposition. For example, dairy breeds have a greater proportion of internal fat than beef breeds. Recent work has found differences between breeds, with Aberdeen Angus crosses having 25 per cent fat tissue compared with 19 per cent for Limousin crosses.
Sex also has a significant impact. In one study, Shorthorns heifers typically had 5.6kg (18 per cent ) more fat in the carcase than steers and 13.7kg (45 per cent ) more than bulls when slaughtered, with heifers having more fat relative to muscle and an earlier onset of the fattening phase.
Diet impacts include a lower proportion of subcutaneous fat for cattle fed on a mixed grass and cereal diet than the same breeds on a cereal-based diet, with the level of fat trim increasing as the proportion of cereals fed increases.
Project Findings
The work by Scotland’s Rural College (SRUC) suggests that as an animal ages there is a greater increase in fat trim compared with saleable meat. It can be seen from the example below that at 450 days the fat trim was 140g/kg of saleable meat yield, but at 600 days the fat trim equates to 240g/kg.
Change in the ratio of fat trim to saleable meat yield for medium-sized breed steers fed intensively
Lean tissue is comprised of about 74 per cent water, 20 per cent protein and 6 per cent lipid, whereas fat tissue is comprised of about 24 per cent water, 9 per cent protein and 67 per cent lipid. This helps explain why the energy required for liveweight gain increases as the animal ages, as fat deposition requires four times more energy than lean tissue.
There appears to be a 1.5 to 2 per cent fat trim increase as animals move from R4L and R4H. It is predicted that moving from R4L to R4H will take about 39 days for a steer or 37 days for heifers of a medium-sized breed, on an intensive-feeding regime. On an extensive-feeding regime, the time would be about 53 and 51 days, respectively.
Change of Deposition of Lean and Fat Tissue Over Time
Finishing cattle
The changes of lean and fat tissue over lifetime are described in the literature review. To highlight the changes more specific to the objectives given for this report, the changes are presented for a specific scenario, i.e. a medium breed of steers under an intensive feeding system, using the developed model of this study. The developed model will be explained in more detail in later sections.
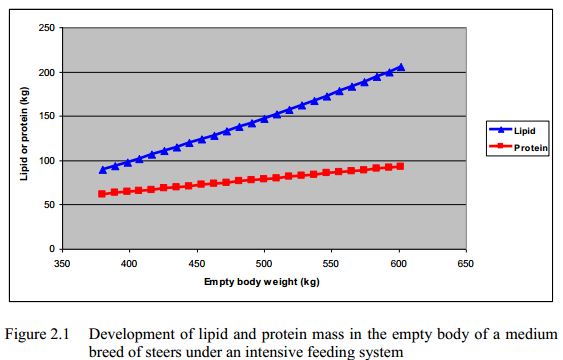
In most studies, the changes of lipid and protein depending on empty body weight are presented. In the model developed, we used the ARC (1980) equations and a basic growth pattern obtained in a SAC beef finishing trial.
Figure 2.1 presents the development of protein and lipid mass depending on the empty body weight. The empty body weight is defined as difference between body weight and weight of digesta in the gastrointestinal tract, including urine content of the bladder.
The shapes of the curves indicate a quadratic increase in lipid mass whereas protein mass increased almost linearly. This information of protein and lipid mass is used to determine the nutritional requirements of animals and it highlights the substantial increase in lipid at the end of the growing finishing period. The difference between lipid and protein mass and empty body weight is mainly water and some ash (minerals).
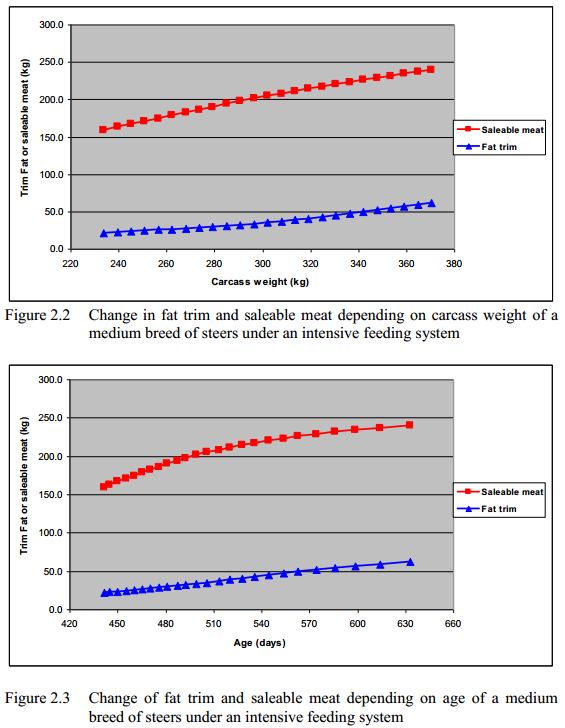
Based on data from the beef yield project of EBLEX (2011), we transformed the protein and lipid mass into fat trim and saleable meat for this scenario (Figure 2.2). The saleable meat yield increases with increase in body weight, but not as linear as for protein. The fat trim is increasing quadratically but the absolute value is much less than for saleable meat. The difference in mass is due to the high water content of saleable meat in comparison with fat trim. The composition of chemical components of saleable meat and fat varies. Holland et al. (1991) reported that in purchased meat, the lean tissue in growing cattle comprises of 74 per cent water, 20.3 per cent protein and 4.6 per cent lipid, whereas fat tissue comprises of 24 per cent water, 8.8 per cent protein and 66.9 per cent fat.
The influence of reduction in growth rate on the change of saleable meat and fat trim is shown in Figure 2.3. That means that with increase in age particularly the growth rate of saleable meat decreases whereas the rate of fat tissue growth decreases substantially less. To get a more obvious indication of the difference in change fat tissue growth rate to saleable meat growth rate, their ratio was presented in Figure 2.4.
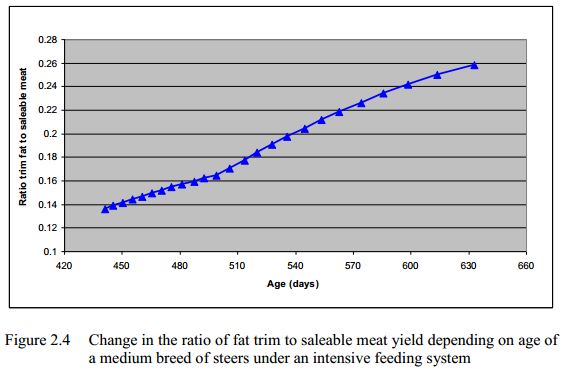
The ratio of fat trim to saleable meat yield increase from 0.14 to 0.26 during growth from 440 to 630 days of age, i.e. that per 1 kg gain of saleable meat, the fat trim increased by 140 g and 260 g at 440 and 630 days of age, respectively. This indicates the substantial increase in fat tissue during the finishing phase of beef cattle. The slight break in the curve at 500 days of age is due to the methodology used for the transformation and is expected in reality to be smoother.
Carcass Fat Processing
In beef cattle the time spent dressing a whole carcass in the slaughter line is about 3 minutes. The costs involved in disposing of the fat from beef carcasses removed at the slaughter line are about £1.15 per carcass. Further trimming of about 25 minutes per whole carcass occurs in the cutting plant. The fat is sent by vacuum to the fat rendering plants. There, the fat is minced, melted and processed for human >consumption and/or tallow.
McNaughton (2012) describes the market value of fat and bones as follows:
- Soft fats out of the slaughter (gut fat, kidney suet, etc) are sent for rendering into tallow. This tallow can be used to create soaps/gels or processed into other chemicals. Poorer quality tallow will end up as fuel or is converted into biofuels.
- Most hard fat ex boning go for render into tallow. But some of the best/cleanest may be sold for incorporation into sausages and other >manufacturing products. Fat prices in January 2012 are approximately 25-30p/kg.
- Bones also go to the rendering companies. If they are from cattle under 30 months, the bone meal can be used for pet feed. Other bone meal would need to be used for burning/land fill. Bone prices in January 2012 are around 3p/kg.
- Using 11 per cent fat trim value at 35p/kg, 20 per cent bones valued at 3p/kg and 340 p/kg, the low values of 31 per cent of fat trim and bones means that the remaining saleable meat has an effective purchase price of 486 p/kg, before taking into account cost of slaughter, butchering, etc.
- Generally abattoirs do not trim lamb carcasses on the slaughter line. In the cutting plant, the time spent trimming is about 2.2 minutes per carcass.
Potential Cost Benefit
Considering an annual UK production of 898,000 T dressed beef and veal (Defra, 2010) and assuming 10 per cent trimming, this production results in 99,700 T fat trim. At a producer value of £3.40 per kg dead-weight, this represents £339m paid for fat trim to the farmers. This represents rather an upper level of the benefit of avoiding excess fat during processing, because it is assumed that fat trim has no retail value, which is expected to be higher than the costs for trimming a carcass and the costs involved in disposing of fat.
Considering an annual UK production of 287,000 T dressed sheep and mutton (Defra, 2010), and assuming 5 per cent trimming, this production results in 15,100 T fat trim. At a producer value of £4.40 per kg dead weight, this represents £66m paid for fat trim to the farmers. Again, this represents rather an upper level of the benefit of avoiding excess fat during processing because it is assumed that fat trim has no retail value.