Strong Year For Irish Beef: Review Of 2010
Following difficult trading conditions due to weak market demand for much of 2009 and early 2010, particularly for higher value cuts, the European beef market stabilised during the course of 2010, reports Bord Bia, the Irish Food Board. 11 April 2011
 6 minute read
Cattle and Beef
A combination of tighter availability, a more positive currency situation and increased demand for European beef from markets such as Russia and Turkey helped trade.
The prospects for 2011 point to the relatively tight supply situation continuing across Europe while Irish finished cattle supplies are also set to tighten considerably.
Household purchase data from the UK shows that for the quarter ending the 31st October, the volume of beef purchased by UK households rose by more than 2 per cent . Figures for France show a recovery of more than 3 per cent in retail beef sales as the year progressed.
Consumer decisions will be closely related to economic developments and with most of our main European markets forecasting some recovery in 2011, there is reason to expect some improvement in beef consumption.
Mixed trends were evident in beef production across the EU in 2010 with a fall of less than 1 per cent anticipated in total EU output. Some fall was evident in fresh/frozen imports during 2010 with shipments estimated to have dropped by around 10 per cent . This leaves imports a third below the levels recorded as recently as 2007.
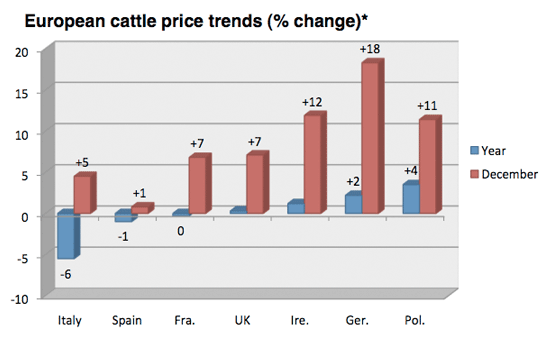
Cattle prices across Europe were sluggish for much of 2010 as consumers continued their search for value. The weighted EU-15 R3 male cattle price was virtually unchanged at €3.16/kg. However, some recovery was evident in the second half of the year, in particular December when prices were 8 per cent higher than corresponding 2009 levels with the largest rise evident in Germany.
*All prices refer to R3 young bulls with exception of Ireland and UK which refer to R3 steer
Cattle disposals higher
Total cattle disposals in 2010 were almost 9 per cent higher than previous year levels at just 2.1 million head. This reflected significant carryover of stock into 2010, combined with strong live exports throughout the year. The key trends in disposals during 2010 were as follows:
- Exports meat plant supplies increasing by 8 per cent.
- Live exports 19 per cent higher
Irish cattle disposals, 2010 vs. 2009 (‘000 head)
| 2009 | 2010(e) | %Ch | |
|---|---|---|---|
| Export meat plants | 1,525 | 1,643 | +7.7 |
| Live exports | 286 | 339 | +18.5 |
| Local abattoirs | 75 | 72 | -4.0 |
| Total | 1886 | 2,054 | +8.9 |
|
Source: Bord Bia
|
|||
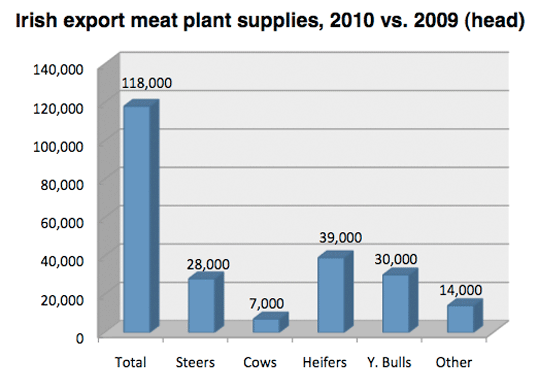
Export meat plant supplies up by almost 8 per cent
Cattle throughput at meat export plants increased by almost 8 per cent to 1.64 million head. Prime cattle supplies increased by more than 8 per cent to 1.26 million head, reflecting a strong carryover of supplies into 2010 from the previous year. For the first half of the year, throughput of prime cattle was higher by 75,900 head, there was a further increase of 19,700 head in throughput in the second half.
In terms of the different categories of cattle, the steer category was four per cent higher a year earlier at 663,500 head. The majority of this increase was due to calf registrations increasing by 4 per cent in 2008 and a decline in live exports of 60,000 head in the same year. Supplies of heifers were more than nine per cent higher at 443,900. Young bull throughput was up by a quarter to 149,700 head as increasing numbers of producers finish young bulls.
Carcase weights increase
There was some change in carcase weights across some of the categories during 2010 as better grazing conditions boosted thrive for much of the year.
Average heifer carcase weights increased by more than 5 kg to 294kg while cows rose by 11kg to 309kg. However, young bull and steer carcase weights fell by 2kg and 1kg to 358kg and 356 kg respectively.
Average Carcase weights at meat export plants(kg)
| 2009 | 2010 | %Ch | |
|---|---|---|---|
| Steers | 357 | 356 | -0.3 |
| Heifers | 289 | 294 | +1.7 |
| Cows | 298 | 309 | +3.7 |
| Young Bull | 360 | 358 | -0.5 |
|
Source: Department of Agriculture, Fisheries and Food
|
|||
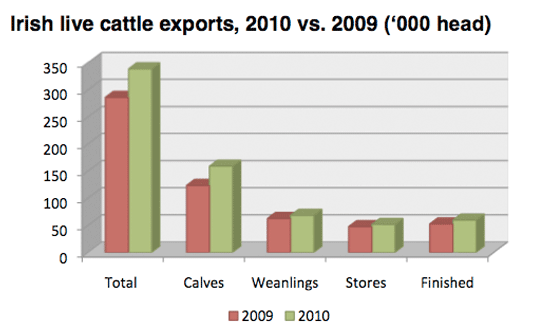
Live cattle exports 19 per cent higher
Live cattle exports reached an estimated 339,000 head in 2010, which was almost 19 per cent above the level recorded in 2009. The value of this trade increased by 16 per cent to €183 million. The principal factors driving increased exports during the year were, stronger demand for Irish calves in the Benelux region, strengthening feedlot demand in Spain and Italy and some further rise in the level of finished cattle exports to Northern Ireland.
Calf supplies on the Dutch market from Germany and France remained tight, combined with the continued absence of UK calves due to TB issues led to demand for Irish dairy calves on the Dutch market been strong throughout the year, albeit slightly back on last year levels. Additionally, there was a strong lift in the number of calves going to the Belgian market, with numbers up 80 per cent to 33,300 head, although reportedly large quantities of the Belgian calf market are destined for neighboring markets.
The Spanish market continues to strengthen, with calves continuing to account for more than half of total shipments to the market. For the year, calf exports are estimated to have increased by 29 per cent to around 159,000 head with the Netherlands taking 39 per cent of the total.
Exports of weanlings and store cattle also performed strongly, rising by 9 per cent to 120,000 head. Shipments to Italy increased by 26 per cent to 70,600 head despite a recovery in the volume of French cattle on the market. Shipments of weanlings and stores to Spain were largely unchanged from 2009 levels at 24,300 head. Exports to the UK Increased by around 14,000 head to reach 103,500 head for the year with around 95,000 of the total destined for Northern Ireland. Exports of finished cattle to Northern Ireland rose by 7,700 head to 54,200 head, while shipments of finished cattle to Great Britain were maintained at 4,000 head.
Cattle Prices
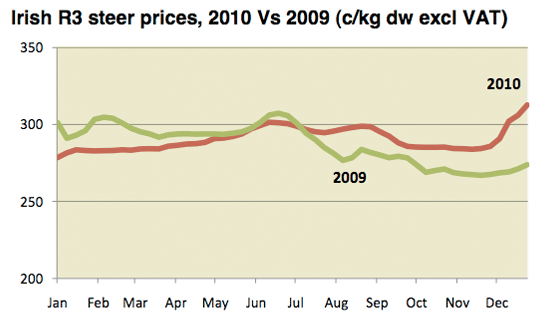
Average prices across all categories of cattle increased slightly in 2010, reflecting a stronger finish to the year in response to better market and across Europe and international markets combined with some tightening of domestic supplies. Steer prices were 1 per cent higher at €2.91 kg dw excl. VAT. The highest prices were recorded in December, with prices 11 per cent of a year earlier at €3.11 kg dw excel. VAT.
R3 heifer price trends were similar, with prices for the year as a whole increasing by 2 per cent to €2.99 /kg dw excl. VAT.
Cow prices showed the greatest increase, reflecting stronger manufacturing beef demand across the UK and in Russia in particular. Cow prices for the year were 3 per cent higher at €2.42/kg excl. VAT, with prices in the last quarter showing significant improvement on prior year levels, as prices rose by almost 13 per cent to €2.41/kg excel. VAT.
Higher finished cattle availability, recovering retail sales and a better currency situation helped shipments of Irish beef to the United Kingdom during 2010. Export volumes increased by almost 7 per cent to reach 260,000 tonnes and were valued at some €685 million. This represents a rise of more than €25 million in the value of exports.
Export volumes to Continental EU markets increased by 12 per cent during 2010 to reach 237,000 tonnes with trade valued at €820 million. Trade was helped by stronger availability and improving market demand as the year progressed. Shipments were boosted by increasing exports from other EU suppliers to Russia and Turkey. The strongest growth in exports was evident in France, Italy and the Netherlands.
Having started the year at very slow levels, exports of Irish beef to International markets picked up considerably during the latter part of 2010, helped largely by increased demand from Russia as other EU suppliers diverted increasing volumes to Turkey. For the year, it is estimated that exports reached around 8,000 tonnes.