US Beef and Dairy Outlook Report - May 2009
By USDA, Economic Research Service - This article is an extract from the May 2009 issue of Livestock, Dairy and Poultry Outlook Report. 18 May 2009
 18 minute read

Dairy: Herd contraction and below-trend increases in output per cow combine to lower milk production in 2009. For next year, further reductions in herd size will overcome productivity increases to reduce milk production further. Lower exports of all products except whey, both this year and next—along with lower domestic commercial use compared with last year—will keep prices low. Next year, reduced supplies should allow for some price recovery.
Cattle/Beef Trade: Poor economic conditions worldwide and a strong U.S. dollar are hampering demand for U.S. beef abroad. U.S. beef imports have increased over 2008 and could continue as foreign exporters send beef to the United States in lieu of other declining international markets.
Cattle/Beef: Drought concerns are decreasing due to recent rains in many areas. Cow slaughter has begun a seasonal decline, compounded by a wait-and-see attitude on the part of dairy producers with respect to the Cooperatives Working Together program announced last month. The likelihood of fewer cows in 2010 suggests potentially fewer calves and tighter fed cattle supplies in 2010-11 that could result in reduced beef production.
Dairy
Herd Liquidation, Already Underway, To Accelerate Later in 2009; Recovery Expected in 2010
The prospect of high feed prices and low milk prices is expected to continue to pressure dairy herd contraction for the balance of 2009 and throughout 2010. The calculated milk-feed price ratio stands at 1.55 and is expected to show only modest improvement in 2010. Consequently, the U.S. dairy herd is forecast to contract to an average of 8.95 million cows in 2010 following a retrenchment to an average 9.18 million cows this year. The 2.5-per cent contraction forecast for 2010 exceeds the 1.5-per cent contraction expected in 2009. According to the March Milk Production report, the total number of milk cows in the United States fell below the number on farms in 2008 by 8,000 head. Thus, the bulk of the herd contraction will likely occur in the second half of 2009 and into 2010. The Cooperatives Working Together program will likely remove slightly over 100,000 cows from the nation’s herd, with actual liquidation occurring over the summer.
Production per cow is expected to be weak for the balance of 2009, averaging a quarter per cent year-over-year rise, adjusted for leap year. However by 2010, a rebound is forecast as the remaining cows will be more productive, and a slight improvement in the milk-feed price ratio may encourage feeding a higher quality ration. The year-over-year increase in output per cow is forecast to climb by over 2 per cent next year. First-quarter cow slaughter was 17.4 per cent above first-quarter 2008, but in recent weeks the rate has fallen to about 5 per cent ahead of the yearearlier level. Herd liquidation will likely pick up steam in the third and fourth quarters of 2009 and continue into next year. Milk production in 2009 is projected to decline to 187.7 billion pounds and to 186.8 billion pounds in 2010 as herd liquidation trumps output per cow increases.
Weakness in domestic demand, combined with a significant drop in exports, is the factor underlying low milk and dairy product prices. Milk equivalent exports on a fats basis totaled 8.8 billion pounds in 2008, the projected total for 2009 is 3.7 billion pounds, and USDA forecasts for 2010 exports are 3.8 billion pounds. The equivalent totals on a skims/solids basis are 26.6 billion pounds actual in 2008 and an estimated 15.3 and 22.0 billion pounds in 2009 and 2010, respectively. USDA projects 2009 exports of cheese, nonfat dry milk, and butter to trail 2008. Whey is the only exception. The sharp downturn in exports has led to greater supplies of milk and dairy products that must clear the domestic market. This year’s domestic commercial use is projected to rise by 1.4 per cent from last year to 186.8 billion pounds, with lower prices for dairy products prompting additional use. In 2010, domestic commercial use is expected to be flat as tighter milk supplies and improving demand boost product prices.
Although increasing through the year, most product prices are expected to remain below last year for the balance of 2009. An upturn is not likely until 2010. Cheese prices are expected to average $1.245 to $1.295 per pound in 2009. Prices for cheese have been close to support levels in recent weeks, but prices are expected to strengthen through 2010. The average price is forecast at $1.545 to $1.645 in 2010. For butter, the 2009 prices are expected to average $1.165 to $1.245 per pound for the year. In 2010, prices could rise to average $1.430 to $1.560 per pound.
NDM prices have suffered most, with the loss of export markets and prices reflecting that fact. NDM prices are expected to average 83 to 87 cents per pound this year and 97.5 cents to $1.045 per pound next year. Whey prices show some recovery as exports have improved lately and will average 19.5 to 22.5 cents a pound in 2009 and likely rise to 24.0 to 27.0 cents a pound in 2010.
These lower product prices will translate to lower milk prices compared with 2008, with some recovery expected in 2010. The Class IV price is projected to average $9.95 to $10.55 per cwt this year and $12.30 to $13.40 per cwt next year. The Class III price is forecast to average $10.55 to $11.05 per cwt this year and to rise to $13.80 to $14.80 per cwt next year. The all milk price is projected to be $11.85 to $12.35 per cwt in 2009 and to climb to $14.70 to $15.70 per cwt in 2010.
Cattle/Beef Trade
Decline in Beef Exports Expected in 2009 Despite First-Quarter Growth
Exports of U.S. beef in the first quarter totaled 384 million pounds, a 7-per cent increase from the same quarter last year. The year-over-year increase can be attributed primarily to a 23-per cent increase in exports to Japan and the resumption of exports to Korea, a market to which the United States did not have access in the first half of 2008. Exports to Mexico and Canada, however, declined 18 per cent and 20 per cent, respectively, in the first quarter. The North American trading partners were the top two beef export destinations in 2008.
Poor economic conditions worldwide and a strong U.S. dollar are hampering demand for U.S. beef abroad. As of May 1, the dollar has strengthened 32 per cent against the Mexican peso, 27 per cent against the South Korean won, and 17 per cent against the Canadian dollar compared with last year. Beef exports to Japan increased in the first quarter. However, they have been increasing at a slower rate compared with the past few years. Some of the effects of the slowing economy in Japan may be mitigated by a weaker dollar relative to the Japanese yen, however, for the beginning of 2009. If the dollar continues to strengthen against the yen as it has over the past few weeks, the Japanese could be motivated to import less U.S. beef, replacing it with other proteins or Australian beef.
Total U.S. beef exports are expected to fall 8 per cent in 2009, to 1.74 billion pounds. Much of the year-over-year decrease is expected to come in the third quarter, which was particularly strong in 2008. Exports should rebound about 10 per cent in 2010, to nearly 1.91 billion pounds. The outlook for 2010 depends on the state of the global economy.
Increased Beef Imports from Australia Drive Outlook for 2009
U.S. beef imports increased 10 per cent in the first quarter of 2009. Australia, which typically vies with Canada to be the largest foreign source of beef in the United States, increased its exports to the United States by 42 per cent. Australian producers’ exports are also being affected by the global economic slowdown. As a result, some Australian beef that went to Asian and Russian markets last year under normal economic conditions is now being redirected to the United States.
Total U.S. federally inspected cow slaughter has been high so far this year, driven primarily by increased dairy cow slaughter and U.S. slaughter of cows and bulls imported from Canada. Typically, imported beef and beef from imported cows and bulls supplements domestic processing beef for grinding. These products are generally mixed with fed-cattle trim to produce ground beef. Domestic supplies of processing beef are expected to remain strong throughout the year. The outlook for imported beef will hinge upon relative prices in the United States relative to prices in the rest of the world. If foreign producers cannot find adequate export opportunities elsewhere, more beef may come to the U.S. market despite relatively high domestic supplies.
U.S. beef imports are expected to increase 12 per cent this year, to 2.84 billion pounds, primarily because of the expected increases from Australia. Next year, U.S. beef imports are expected to continue growing to nearly 2.98 billion pounds, nearly a 5-per cent increase from 2009 forecasts.
Cattle/Beef
Cow Slaughter Declining into Spring
Most areas of the country have received precipitation in recent weeks, easing concerns that dry conditions would extend into the summer grazing season. The far West and Southwest continue to be exceptions. Hay prices are declining, and concerns in some areas have shifted to whether fields will be dry soon enough to plant or harvest crops.
Economic effects from the Influenza A/H1N1 virus on demands for red meat and poultry are difficult to discern beyond the direct impacts of bans by some countries on importing U.S. pork. In some cases, the bans are partial in that they are specific to pork from selected States. Any bans could be short-lived due to the apparent mild effects of the flu on humans. Some analysts have argued that the flu outbreak would have a negative effect on beef/cattle demand and prices as unexported U.S. pork weighs negatively on the U.S. domestic red meat sector. Others argue that the flu outbreak could generate positive effects as increased demands for beef and poultry fill gaps in international demand left by international restrictions on U.S. pork exports. Although both effects may occur, in the short run, they are expected to offset one another so that net impacts on the beef sector will be minor. Beefsector impacts will also be difficult to separate from factors unrelated to influenza that are affecting beef markets.
Dairy cow slaughter has declined recently. While at least part of the decline can be attributed to a well-established seasonal pattern, anecdotal evidence suggests milk producers are withholding dairy cows from slaughter in anticipation of the latest Cooperatives Working Together (CWT) herd buyout. Removal of the 102,000 dairy cows via the most recently announced CWT buyout could begin swelling slaughter numbers as early as this month. This activity will adversely affect cow prices, but will occur at a time when cow slaughter is normally at a seasonal low, so effects should be relatively minor.
As of April, the heifer share of steers and heifers on feed in lots of 1,000 head or more continued its upward trend, climbing from a low in April 2006, and is indicative of a lack of breeding herd expansion. This trend, along with proportionally large cow slaughter, suggests a further decline in total cow inventories during 2009. The ensuing sequentially smaller calf crops in 2009, 2010, and perhaps beyond, and this will likely result in fewer cattle for placement in feedlots and eventual slaughter. These factors will likely translate into the potential for lower beef production from 2010 through at least 2011 or 2012. However, the final outcome will also depend to some extent on grain prices and timing and dressed weights of cattle slaughtered. For example, more cattle could be slaughtered in a given year if heavier placement weights result in shorter feeding period and faster feedlot turnover. Cattle placed in feedlots at heavy weights tend to be heavier when slaughtered, so the combination of heavier weights and more cattle in a given year could result in more total beef production for that year.
Cattle feeders received somewhat of a reprieve in April 2009 when cattle-feeding margins were near breakeven for the first time since May 2007.
This bright spot is largely due to coincidental declines in feed (grain) and feeder cattle prices from their summer (2008) highs and the small price rally in fed cattle markets during April. However, in the absence of steady-to-higher prices for fed cattle, the positive feeding margins are not likely to extend beyond summer.
Ordinarily, packers are able to sell byproducts from slaughter that help cover processing costs and allow them to offer slightly higher prices for cattle. Reduced demand for final leather goods brought on by the worldwide economic downturn has depressed hide values lately. Since byproduct values are driven largely by hide values, this has negatively affected packer margins. Ironically, despite low byproduct values, packer margins are high enough that kills in recent weeks have increased compared with weekly kills during most of first-quarter 2009. Cutout values for Choice steers began a seasonal spring rally in mid-April that may have already run its course, as prices have declined from their weekly high the week of April 25, 2009.
Retail beef prices have actually increased year-over-year for the first quarter, with retail Choice beef prices increasing by 4 per cent. Retail all-fresh beef prices have increased just over 2 per cent. Since these retail prices reflect grocery counter activity, the increases likely reflect grocery demand holding steadier than food service demand as consumers adjust their spending to reflect the uncertain economic conditions and choose grocery purchases for eating at home over restaurant dining.
Special Box: Veal Industry
U.S. Veal Production
Veal is meat from immature bovine animals, called “vealers.” The primary source of vealers in the United States is the dairy industry. Dairy cows must give birth to a calf each year, that is, be “freshened,” in order to continue producing milk. A large per centage of heifer calves are retained as replacements for the dairy herd, but only a few bull calves are retained for breeding stock. As primarily a byproduct of the dairy industry, the nearly 75 per cent of male dairy calves used for veal production typically comprises the veal industry.
Veal is usually classified into two types based on characteristics of the vealers used for production: “Bob” veal and “Special-Fed” veal. Bob vealers are typically marketed up to 3 weeks of age with a weight of less than 150 pounds. Meat from bob vealers is ivory to creamy pink in color and accounts for approximately 15 per cent of the veal market. Special-Fed vealers are fed a special liquid milk replacer diet and marketed at 400-450 pounds, or at 16 to 20 weeks old, depending on regional variations and other factors affecting the beef industry. Special-Fed veal is light grey to pink in color and is the most common type consumed, primarily through hotels and upscale food service establishments. About 85 per cent of the veal calf market is special-fed. Although not common in the United States, vealers can also be fed a variety of diets, including grains and forages, typically termed “non-special-fed,” and marketed at weights of 400-450 pounds and beyond. These calves can also be fed to slaughter weights of 1,200 to 1,400 pounds and sold as beef.
Yearly U.S. commercial calf slaughter
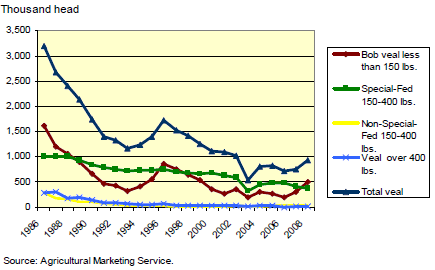
Veal production in the United States has decreased dramatically since the 1960s, from 960 million pounds produced in 1961 to 143 million pounds in 2008. In the last 10 years, the decline in production has been roughly 50 per cent. Per capita domestic veal disappearance has also declined over time. Since peaking in 1944 at 11.2 pounds, consumption has gradually decreased to 0.4 pounds per capita in 2008. Veal imports (primarily from Canada) and exports have historically made up small per centages of total U.S. consumption and production.
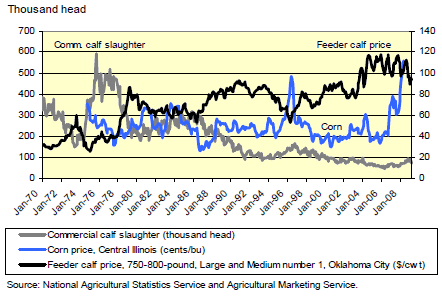
Veal production and demand declines can be attributed to simultaneous declines in dairy cow numbers, increases in feeder cattle prices, and changes in consumer tastes and preferences. Generally, there is an inverse relationship between feeder cattle prices and commercial veal production—as feeder calf prices increase, veal production declines, and vice versa. Veal production is also related to corn prices— as corn prices increase, so does veal production because it becomes too expensive to feed dairy calves to sell as fed cattle. Increased use of dairy bull calves for dairy beef production has also increased the demand for starter calves, tightening the supply of vealers. As a result, prices for vealers have increased.
Any short-term changes in the U.S. veal industry will largely depend on immediate fed cattle prices and dairy cattle supplies. Long-term changes in demand for veal will largely depend on changes in consumer perceptions towards veal production and continued demand from upscale hotels and restaurants that offer veal on their menus.
Yearly U.S. commercial calf slaughter
 >
>Special Box: Organic Dairy
Organic Dairies Losing Money Too
The organic dairy sector has seen strong growth in recent years, with the number of specialized organic dairy farms increasing by 79 per cent from 2002 to 2007 (USDA Agricultural Census). Land used for organic production on specialized organic dairy farms increased by 85 per cent, and total organic dairy product sales increased by 83 per cent over the same period. Like the conventional dairy sector, the organic dairy sector is composed of all types of dairy farms. Small organic dairy farms that grow most of their own organic feed can be found predominately in the Northeast and Midwest, whereas the Western United States. is home to several larger dairies that rely more heavily on purchased organic feed. All organic dairy cows must have access to pasture, per USDA regulations. There is a limited, but growing, amount of data available on organic dairy production at the national level. However, examining the three States with the highest number of organic dairy farms, Wisconsin, New York and Vermont, can shed some light on the current market situation. Organic milk producers in the United States have suffered much the same fate as conventional milk producers, facing falling milk prices and high feed and energy costs.
| Where are organic dairies located? | ||
|---|---|---|
| State | Number of Specialized Organic Dairy Farms | Acres Used For Organic Production |
| Wisconsin | 433 | 87,206 |
| New York | 301 | 79,234 |
| Vermont | 182 | 43,702 |
| Source: 2007 USDA Agricultural Census. | ||
The March 2009 ERS Monthly Milk Costs of Production estimates for conventional dairies in Wisconsin, Vermont, and New York were, on average, $21.54/cwt, $24.94/cwt, and $26.55/cwt, respectively. Organic dairies, on average, have higher production costs by about $5 to $7 more per cwt. Thus, implied production costs for organic dairies in the three States can be approximated at $27-29/cwt (Wisconsin), $30-32/cwt (Vermont), and $32-34/cwt (New York).
According to the Northeast Organic Dairy Farmers Association (NODPA), as of April 2009, pay prices for organic milk by the three largest processing plants in the region (HP Hood, Horizon Organic, and Organic Valley) will average about $27.43/cwt. At current estimates of production costs, organic dairy farmers in Vermont and New York are losing about $4/cwt and $5/cwt, respectively. The average milk price paid to dairy farmers by the two largest organic processors in Wisconsin (Organic Valley and Horizon Farms) is currently $24.63/cwt. At that price, the average loss for Wisconsin organic dairy farmers is $3/cwt. Costs vary greatly across farms and production methods. Farms that rely more on purchased feed inputs can expect to see greater losses than farms that rely more on pasturebased feeds. Organic dairy farmers use fewer feed concentrates and more forage than conventional producers; however, the purchased feed they do use has a higher per unit cost since it must be certified organic feed. For example, prices published by USDA’s Agricultural Marketing Service at the beginning of May 2009 show Upper Midwest organic feed grade corn at about $7.48/bushel, yet conventional no. 2 yellow feed corn was about half the price, averaging $3.90/bushel in Chicago.
| Organic vs. Conventional Milk Cost of Production (COP) and Returns | ||||||
|---|---|---|---|---|---|---|
| State | Organic COP1 ($/cwt) | Organic Farmgate Price2 ($/cwt) | Loss to farmers ($/cwt) | Conventional COP3 ($/cwt) |
Conventional Farmgate Price4 ($/cwt) |
Loss to farmers ($/cwt) |
| WI | $28 | $25 | -$3 | $22 | $12 | -$10 |
| VT | $31 | $27 | -$4 | $25 | $12 | -$13 |
| NY | $33 | $27 | -$5 | $27 | $12 | -$15 |
| 1. Calculated: based on March 2009 ERS Monthly Milk Costs of Production and estimated organic milk cost of production. 2. NODPA. 3. March 2009 ERS Monthly Milk Costs of Production. 4. AMS. |
||||||
While organic milk and dairy products have a higher cost of production, they also receive a higher price at the farmgate as well as the retail level. Organic dairy producers earn an average $15/cwt premium for their product in WI, VT, and NY over conventional milk and, at the retail level, organic milk prices currently average over twice the price of conventional milk. Organic milk accounts for about 6 per cent of retail milk sales and is widely available at all types of outlets, from bigbox stores to conventional supermarkets to small independent retailers. Many supermarkets now offer both private label and branded organic milk products.
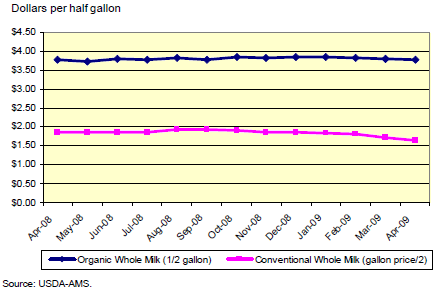
Organic milk retail prices vary substantially by region and brand, but have remained at a premium to conventional milk prices. In April 2009, a half-gallon of organic whole milk in the U.S. retailed for $3.79 on average, compared with approximately $1.64 for conventional whole milk. Conventional milk prices have declined almost 12 per cent from the beginning of 2009 to the present (May 2009). Organic milk prices have been steadier, with roughly a 2-per cent decline during the same period. Organic milk sales showed strong growth during 2008, with an annual increase of 23-per cent for organic whole milk and 19.7-per cent for organic reduced-fat milk, according to AMS Dairy Market News. Sales of both conventional whole milk and reduced-fat milk also increased during 2008, but at a significantly lower rate compared with organic milk sales. Conventional whole milk sales increased by 1.2- per cent and conventional reduced-fat milk by 3.6 per cent in 2008.
Retail whole milk prices: organic vs. conventional
May 2009