More Cows in England's Livestock Census
ENGLAND - The latest census of pig and cattle numbers in England in December 2013. The dairy herd has increased by 1.5 per cent, while the decline in the beef herd over the last couple of years shows signs of reversing, writes Jackie Linden. 13 March 2014
 3 minute read
Pig Numbers
The total number of pigs in England increased by 5.5 per cent since December 2012 to just over 3.6 million, and reverses the decline seen over the last few years.
The rise was driven by a 7.0 per cent increase in the number of fattening pigs to just under 3.2 million. This was partially offset, however, by a fall in the number of breeding pigs by 4.2 per cent to 411,000 animals in December 2013.
| Table 1. Pigs on commercial agricultural holdings in England on 1 December (thousands) | ||||||
| 2009 | 2010 | 2011 | 2012 | 2013 | % change 2013 / 2012 | |
|---|---|---|---|---|---|---|
| Total pigs | 3,575 | 3,514 | 3,489 | 3,417 | 3,607 | 5.5 |
| - Breeding pigs | 415 | 415 | 415 | 429 | 411 | -4.2 |
| - Female breeding herd | 346 | 342 | 337 | 332 | 326 | -2.0 |
| - Sows in pig | 241 | 223 | 281 | 227 | 226 | -0.5 |
| - Gilts in pig | 50 | 57 | 56 | 57 | 50 | -13.3 |
| - Other sows | 55 | 63 | 63 | 48 | 50 | 4.4 |
| - Other breeding pigs | 69 | 72 | 78 | 97 | 86 | -11.9 |
| - Boars being used for service | 14 | 14 | 13 | 13 | 13 | -3.3 |
| - Gilts intended for first-time breeding | 55 | 59 | 65 | 84 | 73 | -13.3 |
| - Fattening pigs (incl. barren sows) | 3,160 | 3,100 | 3,074 | 2,988 | 3,195 | 7.0 |
In December 2013 compared to a year earlier, there are noteworthy double-digit reductions in two categories, namely pregnant gilts and gilts intended for first-time breeding, both of which are down by more than 13 per cent. These changes point to further and significant reductions in the English breeding herd ahead.
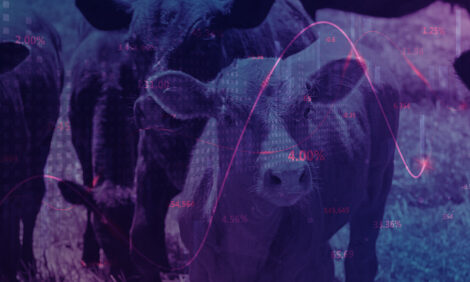
Cattle Numbers
According to the latest census, published by the agriculture department last week, the total number of cattle and calves in England increased by 0.3 per cent to 5.3 million between December 2012 and December 2013, continuing the slight upward trend in numbers for a second year.
England’s dairy herd increased by 1.5 per cent to 1.1 million while the beef herd continued to fall, down by 2.6 per cent to 699,000 during 2013.
| Table 2. Cattle and calves on agricultural holdings in England on 1 December (thousands) | ||||||
| 2009 | 2010 | 2011 | 2012 | 2013 | % change 2013 / 2012 | |
|---|---|---|---|---|---|---|
| Total cattle & calves | 5,465 | 5,434 | 5,275 | 5,308 | 5,323 | 0.3 |
| All female cattle | 3,955 | 3,946 | 3,849 | 3,843 | 3,843 | 0.0 |
| Aged 2 years or more | 2,390 | 2,380 | 2,276 | 2,254 | 2,269 | 0.7 |
| Total breeding herd | 1,911 | 1,909 | 1,851 | 1,841 | 1,838 | -0.1 |
| - Beef herd | 731 | 745 | 730 | 718 | 699 | -2.6 |
| - Dairy herd | 1,181 | 1,164 | 1,122 | 1,123 | 1,139 | 1.5 |
| Other female cattle | 478 | 471 | 425 | 413 | 430 | 4.2 |
| - Beef | 215 | 206 | 169 | 171 | 188 | 10.1 |
| - Dairy | 263 | 265 | 256 | 242 | 242 | 0.0 |
| Aged 1 to 2 years | 760 | 741 | 742 | 761 | 764 | 0.4 |
| - Beef | 456 | 422 | 419 | 434 | 436 | 0.6 |
| - Dairy | 303 | 318 | 323 | 328 | 328 | 0.1 |
| Less than 1 year | 805 | 825 | 830 | 828 | 810 | -2.1 |
| - Beef | 478 | 491 | 494 | 488 | 472 | -3.3 |
| - Dairy | 325 | 335 | 337 | 339 | 338 | -0.4 |
| All male cattle | 1,510 | 1,488 | 1,427 | 1,466 | 1,480 | 1.0 |
| Aged 2 years or more | 215 | 202 | 175 | 176 | 202 | 14.5 |
| Aged 1 to 2 years | 564 | 550 | 532 | 544 | 562 | 3.3 |
| Less than 1 year | 731 | 737 | 720 | 746 | 717 | -3.8 |
| Figures sourced from the Cattle Tracing System (CTS). Data include returns from all holdings with cattle so are not subject to survey | ||||||
The number of beef cows aged two years or more that are not destined for the breeding herd was 10 per cent higher in December 2013 than 12 months previously, while the number of male cattle of this age was up by more than 14 per cent.
These are signs that the beef industry has taken considerable steps towards recovery from a crisis in 2010-11, when beef prices to producers were very low.