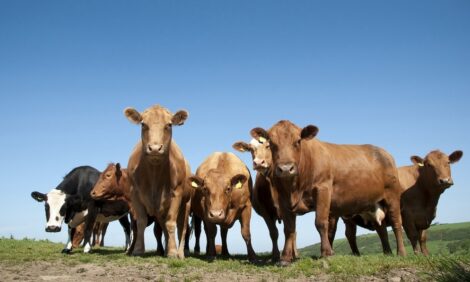
UK Slaughter Statistics
UK - The latest statistics produced by Department of Environment, Food and Rural Affairs show that the number of animals slaughtered decreased between October and December 2009, whilst carcase weights remained relatively static. 18 January 2010
 2 minute read

Monthly statistics on the slaughter of cattle, sheep and pigs, dressed carcase weights and meat production are published for the UK to December 2009.
In this issue:
- UK monthly slaughter.
- UK monthly average dressed carcase weights.
- UK monthly home-killed production of meat.
- UK average weekly slaughter estimates.
- UK slaughterings by country.
1. UK monthly slaughter estimates
Table 1 shows the UK monthly slaughter estimates for cattle, sheep and pigs. The number of animals slaughtered reduced significantly between October and December, a trend which is similar to previous years, as slaughter peaks in October.
| United Kingdom | October 2009 5 weeks |
November 2009 4 weeks |
December 2009 4 weeks |
|---|---|---|---|
| Steers | 106 | 86 | 76 |
| Heifers | 79 | 67 | 65 |
| Young Bulls | 28 | 24 | 23 |
| Cows and Adult Bulls | 57 | 49 | 41 |
| Calves | 6 | 4 | 4 |
| Other Sheep and Lambs | 1548 | 1244 | 1141 |
| Ewes and Rams | 216 | 194 | 158 |
| Clean Pigs | 955 | 796 | 763 |
| Sows and Boars | 23 | 18 | 16 |
|
Thousand head |
|||
- A dataset showing slaughter statistics for the same months in previous years can be found on the Defra website at https://statistics.defra.gov.uk/esg/datasets/slaughm.xls
2. UK average dressed carcase weights
The surveys of slaughterhouses also collect information on the meat produced which enables average dressed carcase weights to be calculated. Monthly average dressed carcase weight for livestock slaughtered for meat in the United Kingdom are given in the table below.
| United Kingdom | October 2009 |
November 2009 |
December 2009 |
|---|---|---|---|
| Steers | 362.4 | 360.6 | 362.2 |
| Heifers | 314.8 | 315.6 | 316.2 |
| Young Bulls | 353.2 | 346.5 | 347.4 |
| Cows and Adult Bulls | 313.9 | 312.1 | 312.7 |
| Calves | 31.3 | 36.8 | 33.9 |
| Other Sheep and Lambs | 18.9 | 18.8 | 17.9 |
| Ewes and Rams | 24.5 | 24.8 | 26.4 |
| Clean Pigs | 78.8 | 79.6 | 78.2 |
| Sows and Boars | 161.9 | 155.6 | 158.0 |
|
Kilogramme |
|||
- A dataset showing slaughter statistics for the same months in previous years can be found on the Defra website at https://statistics.defra.gov.uk/esg/datasets/alldcw.xls
3. UK monthly home-killed production of meat
The surveys of slaughterhouses also collect information on the meat produced. This enables the total quantity of meat produced in the United Kingdom to be calculated. Home-killed production includes livestock imported into the United Kingdom for slaughter. The figures are shown in statistical months.
| United Kingdom | October 2009 5 weeks |
November 2009 4 weeks |
December 2009 4 weeks |
|---|---|---|---|
| Beef | 91 | 76 | 69 |
| Mutton and Lamb | 35 | 28 | 25 |
| Pigmeat | 79 | 66 | 62 |
|
Thousand head |
|||
4. UK average weekly slaughterings
|
2008-2009 |
|||||||||||||
|---|---|---|---|---|---|---|---|---|---|---|---|---|---|
| Cattle | Dec | Jan | Feb | Mar | Apr | May | Jun | Jul | Aug | Sep | Oct | Nov | Dec |
|
Steers
|
18 | 17 | 19 | 19 | 19 | 19 | 19 | 17 | 17 | 21 | 19 | 22 | 19 |
|
Heifers
|
15 | 16 | 17 | 17 | 16 | 16 | 15 | 14 | 13 | 15 | 16 | 17 | 16 |
|
Young Bulls
|
4 | 4 | 4 | 4 | 5 | 6 | 6 | 6 | 6 | 6 | 6 | 6 | 6 |
|
Cows And Adult Bulls
|
11 | 10 | 10 | 9 | 8 | 9 | 9 | 9 | 9 | 10 | 11 | 12 | 10 |
|
Calves
|
1 | 1 | 1 | 1 | 1 | 1 | 1 | 1 | 1 | 1 | 1 | 1 | 1 |
|
Thousand head |
|||||||||||||
Further Reading
| - | You can view the full report by clicking here. |
TheCattleSite News Desk