

Review Of Economic Performance Of Irish Beef Farms 2009
James Breen and Kevin Hanrahan from Teagasc, look at the economic performance of beef farms in Ireland in 2009.Review of the Economic Performance of Beef Farms in 2009
In total 93,000 farms or 90 per cent of the NFS population have a cattle enterprise on their farm, making cattle production by far the most prevalent agricultural enterprise on Irish farms. Given the large number of Irish farms with a cattle enterprise and the large variation that exists between the cattle systems operated, a high degree of variation in output values and production costs between farms can be expected.
There is considerable heterogeneity in Irish beef production systems. However, as noted earlier, many farms that are not classified as cattle farms under the NFS farm typology have a beef enterprise. All farms, both specialist cattle and non-specialist cattle farms, with greater than five cattle livestock units are included in this analysis. This article analyses the economic performance of Irish cattle production in 2009 by classifying these farms on the basis of their dominant cattle system.
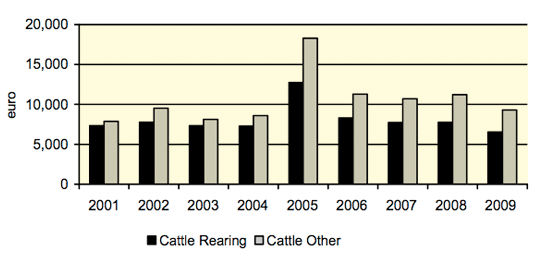
The trends in average family farm income (FFI) for the two main classifications of cattle farms in the Teagasc National Farm Survey (NFS) over the period 2001 to 2009 are shown in Figure 1. In 2009 the average FFI on cattle rearing and cattle other farms decreased significantly when compared with 2008. FFI on the Cattle Rearing farms declined by over 15 per cent when compared with the 2008 level, while FFI on Cattle Other farms, at €9,302, was almost 17 per cent lower than in 2008.
Figure 1 also illustrates that the divergence between the average FFI earned on farms in the cattle rearing system and the average income earned on the cattle other system that emerged post decoupling has been maintained. In 2001 the difference in average FFI between cattle rearing and cattle other farms was €500. By 2009 the difference in average family farm incomes earned on these two cattle farm types was over €2,700. As noted in Breen and Hanrahan (2010) this divergence is a consequence of the decoupling of direct payments and the negative impact of this decision on the prices of weanlings and store animals sold by cattle rearing enterprises and the positive impact of this change on the income of those farms purchasing and finishing these animals.
Figure 1: Family Farm Income on Cattle Rearing and Cattle Other Farm Systems: 2001 to 2009
Specialist cattle farms, as defined by the NFS farm typology, account for approximately 56,200 farms or just over 55 percent of the NFS farm population. However, there were a further 36,700 non-specialist cattle farms that also had a cattle enterprise in 2009.
Comparison of Alternative Beef Production Systems in 2009 This section discusses the cost structure for four of the more common categories of beef production systems prevalent in Irish agriculture: single suckling (SS), cattle born to dairy cows and reared on dairy farms (RD), weanling to store/finish (WF) and store to finish (SF). We have categorised each of the four cattle enterprises analysed on the basis of net margin per hectare and broken these sets of farms into three equally sized groups which we have termed farms with least, average and most profitability.
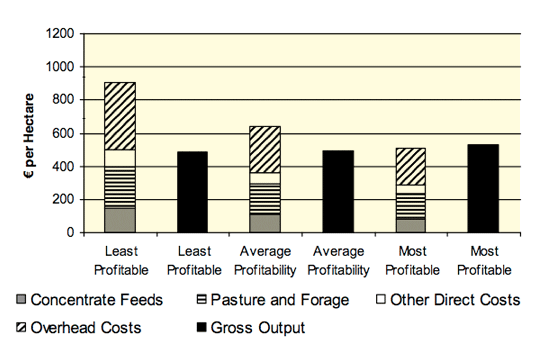
Single Suckling (SS): In 2009 the average direct cost of production per hectare (ha) for SS beef systems ranged from €497 per hectare on the least profitable farms to €290 per hectare on the most profitable farms (see Figure 2 below). This large variation in direct cost expenditure occurred in the absence of variation of any significant magnitude in the value of average gross output per hectare or stocking rate across the least, most and average profitability farms. The cost of concentrate feed along with the cost of pasture and winter forage accounted for 80 percent of the direct costs of production on SS farms. The average expenditure on concentrate feed varied from €144 per hectare on the low profitability farms to only €80 per hectare on the high profitability farms. As shown in Figure 2, considerable variability in the other overhead cost category also exists between farms, with the level of overhead costs per hectare varying from €409 on the least profitable farms to €218 per hectare on the most profitable third of single suckling farms. The most profitable one-third of SS farms earned an average gross output of €527 per hectare in 2009.
Figure 2: Variation in Gross Output and Total Production Costs on Single Suckling Beef farms in 2009
Cattle Reared on Dairy Farms (RD): The second production system analysed involves the rearing of cattle born from the farm’s dairy herd. There are a number of points to note when comparing the RD production system with the SS system. First, while the average gross output earned on RD farms is significantly larger than that earned on SS farms, this is associated with higher average direct costs of production. These higher gross output and costs of production per hectare on RD farms are largely due to the higher stocking rate on these farms when compared with SS farms. The average stocking rate on the RD farms in 2009 was approximately 1.8 cattle livestock units per forage hectare compared with between 1.2 and 1.3 livestock units per forage hectare for the other three cattle systems examined.
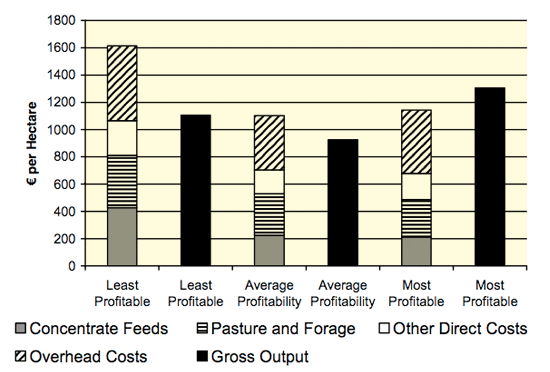
Average direct costs on the three groups of RD farms range from €678 to €1,066 per hectare, see Figure 3. These higher costs are due to high levels of expenditure on concentrate feed and other direct costs. The high expenditure on concentrate feed is due to the earlier weaning of calves on dairy farms and the fact that, other things being equal, finishing dairy cross cattle generally requires higher volumes of concentrate feed per animal than would be required for non dairy cross animals. The high level of other direct costs on RD enterprises is due to the cost of milk and milk substitutes that are fed to calves. While the expenditure on concentrate feed and other direct costs on RD farms are double the level on SS farms, expenditure on pasture and winter forage on RD farms is somewhat closer to the level of expenditure on SS enterprises. The most profitable one third of RD farms had a gross output of €1,307 per hectare compared with €1,105 per hectare on the least profitable farms.
Figure 3: Variation in Total Production Costs and Gross Output on Cattle Reared on Dairy farms in 2009
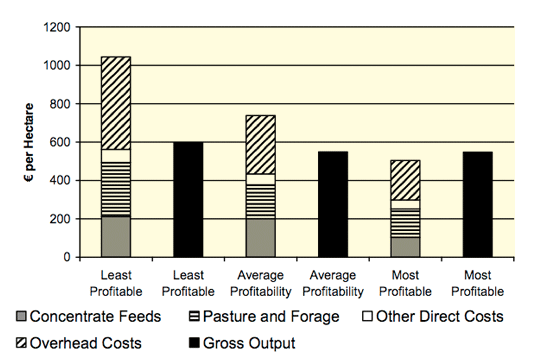
Weanling to Finish (WF): The direct costs of production on farms specialising in buying weanlings which are either sold as finished animals or sold as stores (WF), are in general more variable than those incurred on SS or RD enterprises. The direct costs of production on the weanling to store/finish system in 2009 ranged from €562 on the enterprises in the least profitable group, to €298 per hectare on the most profitable WF enterprise group. Most of the variability in these direct costs is due to differences in expenditure on concentrate feeds (see Figure 4). There is also a considerable degree of variability in the overhead cost category. The gross output per hectare on the least and the most profitable weanling to store/finish farms were quite similar at €596 and €547 per hectare respectively. However as is clear from Figure 4, the least profitable farms had substantially higher costs of production per hectare.
Figure 4: Variation in Total Production Costs and Gross Output on Weanling to Store/Finish Beef farms in 2009
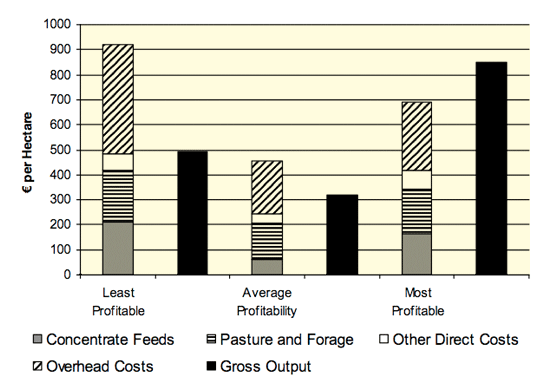
Store to Finish (SF): The final system examined is the store to finish system (SF) (Figure 5), in which animals are purchased as stores and brought to finish. As with the WF farms, expenditure on concentrate feed on SF farms is more variable between farms operating this system than expenditure on pasture and winter forage. Concentrate feed expenditure on SF farms in 2009 ranged from an average of €212 per hectare on the least profitable farms, to less than €62 per hectare on the average profitability farms. There was also a large degree of variation in the average gross output per hectare on the three SF farm sub-groups. Average gross output per hectare on the high profit farms was €848, while gross output per hectare on the least profitable farms was €491 per hectare.
Figure 5: Variation in Total Production Costs and Gross Output on Store to Finish Beef farms in 2009
The results presented highlight the large differences in costs per hectare on what we have termed least, average and most profitable farms. However, it is important to recall that for some systems there are also substantial variations in gross output across the least, average and most profitable farm sub-groups, and that high levels of gross output per hectare are often associated with high levels of direct and overhead costs of production. On the WF and SS farms there was comparatively little variation in the value of gross output per hectare with most of the difference in profitability explained by differences in costs per hectare. On the RD and SF farms there was significant variation in both the value of gross output per hectare and the level of costs per hectare between the least, average and most profitable farm sub-groups. The farms in the most profitable one third of SF and RD groups on average had higher costs per hectare but had sufficiently higher gross output per hectare to ensure an above average profitability performance.
Table 1 summarises the average direct costs, gross output and gross margin across each of the four production systems on a per hectare basis. The highest average gross margin per hectare in 2009 was earned on the RD farms, who earned an average market based gross margin of €390 per hectare. The SF farms had an average gross margin of €332 per hectare, while the SS and WF farms had average gross margins of €256 and €229 per hectare respectively.
Table 1: Average Market Gross Margin per Hectare across Beef Production Systems in 2009
| Single Suckling | Dairy Beef | Weanling to Finish | Store to Finish | |
|---|---|---|---|---|
| Euro per ha | ||||
| Gross Output | 502 | 1101 | 565 | 575 |
| Direct Costs | 377 | 803 | 437 | 380 |
| Gross Margin | 125/td> | 298 | 129 | 195 |
|
Source: 2009 National Farm Survey Data (2010).
|
||||
Comparison of Returns to Cattle Production in 2009
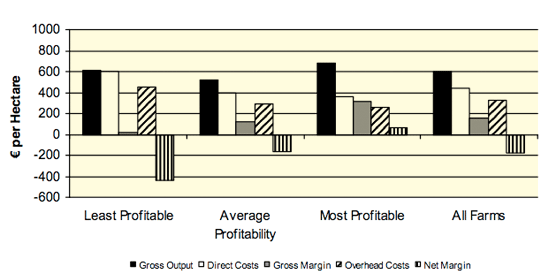
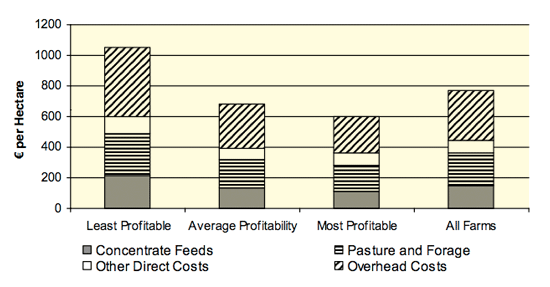
When comparing the costs of cattle production between groups of farms organised on the basis of farm profitability there is a considerable degree of variability between the least profitable one third of cattle farms and the other two thirds of cattle farms. The average total cost of production on the least profitable one third of cattle farms in 2009 was €1,054 per hectare, which was 63 percent higher than the costs of production per hectare on the other two thirds of cattle farms. As we can see from Figure 6, expenditure on concentrate feed accounts for a large share of the difference in total costs between Irish cattle farms. The least profitable farms on average spent €214 per hectare on concentrate feeds in 2009, which is more than 75 percent higher than the average expenditure on the other two thirds of cattle farms. Average expenditure on pasture and winter forage on the least profitable cattle farms was also higher than on the farms with average and above average levels of profit per hectare. The other major difference in costs between the least profitable third of cattle farms and other cattle farms arises in the level of overhead or fixed costs. On the least profitable farms these costs amounted to €456 per hectare, almost 80 percent higher than on the most profitable one third of beef farms.
While the costs of production on the average and most profitable cattle farms are similar, the difference in their profitability is explained by differences in the value of gross output. The average gross output on the most profitable one third of cattle farms in 2009 was €677 per hectare, which is 31 percent higher than the €518 of output per hectare on the farm of average profitability.
Figure 6: Variation in Total Production Costs for all Cattle farms in 2009
The average gross margin on the most profitable farms was €318 per hectare, while the average gross margin on the least profitable one third of Irish cattle farms was €13 per hectare. Only the most profitable third of farms earned a positive average net margin from cattle production, with a net margin of €64 per hectare. The least profitable one third of Irish cattle farms in 2009 earned a negative net margin of €442 on average. It should be noted that these figures do not include the value of decoupled payments.
Figure 7: Variation in Net Market Margin per Hectare for all Cattle farms in 2009
