

Marketing Fed Cattle
Fed cattle are cattle at the completion of a finishing phase that are marketed for harvest, says this Mississippi State University Extension Services Report, by Dr. Jane A. Parish, Dr. Justin D. Rhinehart and Dr. John D. Anderson.
Fed Cattle Pricing Methods
Feedlots will market fed cattle for cattle owners. Several different alternatives exist for pricing and marketing fed cattle. These options include live weight pricing, dressed weight pricing, and grid pricing.
Live Weight Pricing
Marketing fed cattle on a live weight basis involves negotiating a price between the packer and feedlot. Packer buyers visit a feedlot to view cattle on the “show list.” The feedlot manager sets a selling price. The cattle owner can then agree or disagree with the selling price. The packer usually starts with a base Choice carcass value and adds or subtracts premiums or discounts from the expected carcass quality when processed. Then, the adjusted carcass price is multiplied by the expected dressing percentage to obtain a live animal price. Live cattle pricing is done at the pen level. The price is established on the average weight and perceived quality rather than applying a value to each animal.
Example live cattle pricing:
Live weight = 1,240 pounds,
live price = $86.79/cwt1
1,240 pounds x $86.79 / 100 pounds = $1,076.20
cwt = hundredweight
Live cattle pricing requires skill and years of experience by both the feedlot operator and packer or buyer because the actual value of the end product is unknown at the time of the transaction. Even the most experienced buyers and feeders will lose potential revenue because the projected carcass quality is not always reflected at harvest. High-carcass-quality cattle are often discounted and low-carcass- quality cattle often receive premiums.
Dressed Weight Pricing
In dressed weight pricing (often referred to as “in the beef”), the value of the animal is based on the hot carcass weight at harvest. Therefore, the buyer does not have to estimate the dressing percentage. The other aspects of dressed weight pricing are similar to live pricing. The buyer’s estimate begins with a base Choice carcass price and is adjusted for expected quality and yield grades, weight premiums and discounts, slaughter costs, and by-product value.
Example dressed weight pricing:
Carcass weight = 794 pounds,
carcass price = $140.88/cwt 7
94 pounds x $140.88 / 100 pounds = $1,118.59
Live weight and dressed weight pricing methods do not reward improved carcass quality or give incentive to improve real carcass quality by management or genetic selection. Above-average and below-average cattle in a pen receive the same price per hundredweight. The true market value of carcass attributes is distorted, contributing to production inefficiencies that result in inconsistent product quality, failure to provide consumers with beef products of demanded quality levels, and excess fat production as evidenced by the 2005 National Beef Quality Audit for fed cattle.
Grid Pricing
In value-based marketing, animals are priced individually and carcass attributes are known before pricing. Prices convey information about what buyers value. Grid pricing is a form of value-based marketing that began in the mid-1990s. It is the only major pricing method that truly rewards improving carcass quality. The components of this method are fundamentally the same as live cattle pricing and dressed weight pricing. The difference is that the price is adjusted to Quality Grade and Yield Grade at harvest.
In value-based marketing, fed cattle are sold to packers in transactions such as “grade-and-yield” or “on a grid” that require all carcasses in such groups be officially Yield Graded and Quality Graded. Some packers also use their own in-house grades and premium/ discount programs independent of USDA grades.
Determining Beef Value Using Grid Pricing
Many factors determine beef carcass value in valuebased marketing systems. These factors include Quality Grade, Yield Grade, hot carcass weight, meat color (discounts for dark cutters), carcass maturity, and eligibility for specific marketing programs such as Certified Angus Beef®.
Base Prices
Base prices provide a starting point for pricing a beef carcass on a value-based grid. Grid premiums and discounts are applied to the base price to arrive at the grid price for the carcass. The base price for grids can be set in several different ways with many plants using the USDA’s weighted regional carcass price and others using the previous week’s plant average. Base prices can also come from cash dressed prices. Plant average prices are sometimes used for base prices in value-based grids. They are based on a ratio of a fed cattle price and the plant average hot yield (dressing percent). The USDA Agricultural Marketing Service reports weighted average fed cattle prices on a weekly basis.
Example plant average price:
Kansas weekly weighted average as reported by USDA AMS = $90
Plant average hot yield = 63.2%
Base hot price = $90 / .632 = $142.40
Premiums and Discounts
Once the true base price is determined, premiums and discounts are established for carcasses that fall outside the base grid block. These adjustments are based on marbling and the amount of product in the carcass as determined by Quality Grade and Yield Grade, respectively. The grid is structured so that the most valuable carcass would be a Prime Yield Grade 1 and the least valuable carcass would be a Standard Yield Grade 5. Many plants also offer a premium for carcasses that meet the specifications of a branded program. (See Table 1.)
| Table 1. Example Carcass Premium and Discount Grid1 | |||||
| Base = Choice, Yield Grade 3, 600–900 pound carcass | |||||
|---|---|---|---|---|---|
| Prime | +5.00 | YG1 | +2.80 | light carcass | -15.00 |
| Select | -7.00 | YG2 | +1.75 | heavy carcass | -20.00 |
| Standard | -14.00 | YG4 | -12.00 | ||
| Dark cutter | -28.00 | YG5 | -18.00 | ||
| 1Premiums and discounts in $/dressed cwt. | |||||
The example carcass premium and discount grid above includes a base price and hot carcass weight range for the base price. Carcass weight discounts are applied to carcasses outside of the specified range. The base price is for carcasses grading Choice and Yield Grade 3. Premiums are given to carcasses grading Prime and Yield Grade 1 or 2. Discounts are applied for Select, Standard, Yield Grade 4, and Yield Grade 5 carcasses. The same example carcass premium and discount grid is presented below in a different format. This format also specifies a premium for average and high Choice. (See Table 2.
| Table 2. Example Carcass Premium and Discount Grid Alternate Format1 | |||||
| Yield Grade | |||||
|---|---|---|---|---|---|
| 1 | 2 | 3 | 4 | 5 | |
| Quality Grade | ($/cwt carcass) | ||||
| Prime | 7.80 | 6.75 | 5.00 | -7.00 | -13.00 |
| Choice o/+ | 7.30 | 6.25 | 4.50 | -7.50 | -13.50 |
| Choice - | 2.80 | 1.75 | base | -12.00 | -18.00 |
| Select | -4.20 | -5.25 | -7.00 | -14.00 | -20.00 |
| Standard | -11.20 | -12.25 | -14.00 | -21.00 | -27.00 |
| Carcass < 600 lb = -15.00, Carcass > 900 lb = -20.00, Dark cutter = -28.00 | |||||
| Base price = $142.40/cwt | |||||
| 1Premiums and discounts in $/dressed cwt. | |||||
Grid Price Calculation
Grid price calculation is outlined below, for the same steer in the live weight and dressed weight pricing examples.
Grid price ($/dressed cwt) = base price + Quality Grade premium/ discount + Yield Grade premium/discount + carcass weight premium/discount + other premium/discount
In the example (Choice, Yield Grade 2, 794-pound carcass, dressing 64%),
grid price = $142.40 + $0 + $1.75 + $0 = $144.15/cwt
Quality Grade and Yield Grade information along with the carcass weight and any defect information are applied to a grid of carcass premiums and discounts to arrive at a grid price. In this example, using the grid previously shown, there is no premium or discount for Quality Grade, because low Choice is the base Quality Grade for the grid. There is a Yield Grade premium of $1.75/cwt for a Yield Grade 2 carcass.
The hot carcass weight falls within the 600- to 900-pound acceptable range specified by the grid, so there is no heavyweight or lightweight discount. This carcass is also not a dark cutter, bullock, or other defective carcass requiring a discount. Therefore, the carcass value is ($142.40/cwt +$1.75/cwt) x 7.94 cwt = $1,144.55. The live equivalent price is then, grid price x dressing %: $144.15 x 0.64 = $92.26/cwt.
Factors Influencing Grid Pricing Outcome
Appropriateness of a Particular Grid
To effectively use grid pricing for fed cattle marketing, it is critical to know cattle carcass characteristics. Known genetics, health programs, cattle age, disposition, feeding management, and other characteristics prepare the producer to take advantage of grid marketing. Cattle should be produced to target a specific grid. Grid specifications vary widely, so cattle that would do well on one grid may perform poorly on another grid. Grid premiums and discounts not only vary across firms but also can vary across plants within a firm. Good estimations of how cattle will compare against plant average dressing percentages used by the harvest plants of interest are very useful in making grid marketing decisions.
Grid pricing is profitable when cattle characteristics are appropriate for the grid used. Some grids favor high Quality Grades, while others favor high yielding cattle. The USDA Agricultural Marketing Service publishes weekly grid premium and discount price reports as a publicly available source of grid pricing information.
Cattle uniformity makes it easier to decide to use grid marketing. Wide fluctuations in cattle uniformity often lead to wide fluctuations in grid prices for a set of cattle. Grid pricing works best when cattle are uniform and matched to the most appropriate grid.
Sorting cattle based on known genetics and management or based on ultrasound scanning data can reduce uncertainty with grid marketing and make it easier to identify the best grid for a particular set of cattle.
Grid characteristics including base price and Choice-Select spread further determine the desirability of grid marketing for a particular set of cattle. Revenue per head from grid pricing is generally more variable than revenue from live pricing, emphasizing the importance of cattle uniformity to reduce grid pricing variability. This variability increases seller price risk.
Choice-Select Spread
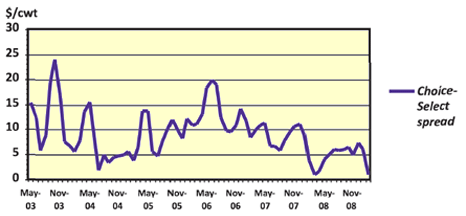
The Choice-Select (CH-SE) spread (Choice minus Select beef prices) usually has a large influence on grid pricing profitability. When the Select discount is low (CH-SE spread is small), marketing lower-quality cattle incurs less of a price penalty. A larger Quality Grade discount is incurred when the spread is wider. This spread changes over time, so be aware of market conditions and current and expected CH-SE spreads.

Figure 1. Monthly Beef Cutout Choice-Select Spread
Adapted from Livestock Marketing Information Center, 2009.
Dressing Percentage
Dressing percentage can also have a large impact on grid pricing outcome. In general, when dressing percentage is below average, a poor grid outcome is expected. When dressing percentage is above average, a good grid outcome is expected.
Example of dressing percentage influence on grid pricing outcome: 1,150-pound live weight with 64% dressing percentage 736-pound hot carcass weight (1150 x .64 = 736) $90 live price / 63% base dressing % = $142.86 hot price live revenue = 1,150 x $90 = $1,035 dressed revenue = 736 x $142.86 = $1,051.45
In this example, having a 1% higher dressing percentage than the plant average used to determine base price is worth about $15 per head in comparison to pricing live. Some (or all) of that $15 could be given back in discounts related to carcass merits (SE or NR quality, YG 4 or 5, light/heavy carcass, dark cutter, hard boned, etc.). (See Table 3.)
| Table 3. Example Dressing Percentage Influence on Grid Revenue1 | ||
| Base dressing % = 63.5% | Base dressing % = 64.5% | |
|---|---|---|
| Base live price | $90.00 | $90.00 |
| Base hot price | $141.73 | $139.53 |
| Quality Grade discount | -$8.61 | $8.61 |
| Yield Grade discount | $1.87 | $1.87 |
| Average grid revenue | $1,021.45 | $1,005.49 |
| Average live revenue | $1,004.48 | $1,004.48 |
| Revenue difference | $16.97 | $1.01 |
| 1Prices, premiums, and discounts in $/cwt | ||
In this example, dressing percentage differs by 1 percentage point (63.5% versus 64.5%). While live pricing is not affected, carcass pricing is impacted with the lower dressing percentage resulting in a higher base carcass price. Similarly, live revenue is not affected by the difference in dressing percentage, but grid revenue is $15.96 higher ($16.97 - $1.01) with the lower dressing percentage.
Cattle Health
Mississippi Farm to Feedlot data show the impact of cattle health on Quality Grade. Healthy, untreated cattle typically have higher Quality Grades than cattle treated for health problems. Similarly, less excitable cattle generally have higher Quality Grades at harvest. Chute exit velocity measurements and pen temperament scores are good methods of assessing cattle temperament. (See Table 4.)
| Table 4. Effect of Cattle Health on Feedlot Performance and Carcass Merit | ||
| Treated; | Untreated | |
|---|---|---|
| Number of head | 183 | 617 |
| Average daily gain, lb/day | 2.83 | 3.01 |
| Live weight, lb | 1,099 | 1,124 |
| Hot carcass weight, lb | 702 | 728 |
| Death loss, % | 14.75 | 1.13 |
| Choice, % | 28.8 | 53 |
| Select, % | 58.8 | 43 |
| Standard, % | 12.4 | 4 |
| Average Yield Grade | 2.61 | 2.91 |
| Source: Mississippi Farm to Feedlot Program, 2000. | ||
Using the Mississippi Farm to Feedlot cattle data on a 2002 industry grid, there is a $64 difference in average grid revenue between healthy and sick cattle in this grid marketing scenario. This difference is primarily the result of a much larger average Quality Grade discount for the treated cattle compared with the untreated cattle. (See Table 5.)
| Table 5. Effect of Cattle Health on Grid Pricing Outcome1 | ||
| Treated | Untreated | |
|---|---|---|
| Premium/discount | ||
| Average Quality Grade | $39.69 | -$0.39 |
| Average Yield Grade | $2.77 | $0.41 |
| Carcass weight | -$4.82 | -$4.97 |
| Average grid revenue | $676 | $740 |
| Average live revenue | $724 | $741 |
| 1Prices, premiums, and discounts in $/cwt. | ||
| Source: Mississippi Farm to Feedlot Program, 2000. | ||
Age, Source, and Process Verification
Special sales often feature feeder and stocker cattle that are age, source, and/or process verified. Significant premiums can be realized for these cattle, often making the investment in documenting and reporting this information profitable. As with any other marketing tool, returns are variable and premiums for verification depend on many other market factors.
It is also likely that this change will follow the pattern of other management tools that began as a way to garner a premium but became the norm and now represent a discount if not practiced, such as preconditioning and vaccination. Source and age verification programs are sometimes mistakenly associated with the National Animal Identification System (NAIS). While the management practices outlined by the NAIS blend well with these programs and facilitate record keeping, participation in NAIS is not a requirement for verification programs.
For age verification, maintain either individual or group calf birth records. Some age verification program requirements allow documentation of the age of the oldest animal in the group to serve as age documentation for the entire group. For source verification, maintain records of cattle location and ownership from birth through harvest. For process verification, maintain records of how a calf is managed from birth until harvest. Process verification records include records of animal health product and growthpromoting implant administration, weaning dates, management practices, feeds and feed additives used, and supporting product receipts.
Some animal health product companies specify process verification protocols using their products. Some verification programs use producer affidavits as part of their documentation. To capture added value from verification programs, cattle buyers must be will- ing to offer higher prices for feeder and stocker cattle with this form of traceability or cattle ownership must be retained through harvest, at which time beef pack- ers pay per head premiums for this information.
Traceability goes from end product back to point- of-origin as well as from point-of-origin to end prod- uct. With cooperation from feeders and packers, this enables cow-calf producers and stocker operators to track cattle feedlot and carcass merits. If cattle are expected to perform exceptionally well in the feedlot or are well-suited to a specific grid marketing option, retaining ownership through finishing and harvest may be more profitable than marketing at weaning.
Producers also can use this information to improve genetic selection and management to better suit target markets. The Mississippi Farm to Feedlot program provides an opportunity for cattle producers to learn more about cattle genetics, marketing, verifi- cation programs, cattle finishing, and risk manage- ment. Cattle shipments are accepted year-round for this educational program facilitated by the Mississippi State University Extension Service.
Summary
Grid pricing was developed with the goal of improv- ing the overall quality and consistency of beef pro- duced in the United States and ultimately to improve demand for the product. This occurs by rewarding improved quality and by creating a more consistent way to report and collect data at the individual animal level. The expectation is that producers will change carcass characteristics through genetic selection and management practices in response to market signals provided through value-based marketing.
However, there is little evidence to suggest that grid prices are providing efficient price signals to buy- ers and sellers with respect to market valuation of desirable and undesirable beef carcass characteristics. In grid pricing, marbling and the indicators of Yield Grade (back fat, hot carcass weight, ribeye area, and internal fat) explain about 30 to 40 percent of individ- ual carcass value. The most important factor affecting carcass value remains carcass weight.
Some estimates claim that more than half the fin- ished cattle marketed in the United States are valued through a grid pricing structure. These sources also indicate that grid pricing will soon become the domi- nant marketing channel for fed cattle. More recently, however, research shows that the adoption of grid pricing has been slower than projected and has not yet taken half of the market share. Regardless of the pace of adoption, grid marketing is likely to become the industry norm in the future.
While seller risk is increased with grid pricing, its returns should exceed live cattle pricing returns when uniform cattle are matched to appropriate grids. This can be the case even with below-average cattle if dressing percentage, CH-SE spread, and plant aver- ages are favorable. The greatest challenge in using grid pricing is that carcass merits and plant averages are unknown until after harvest.

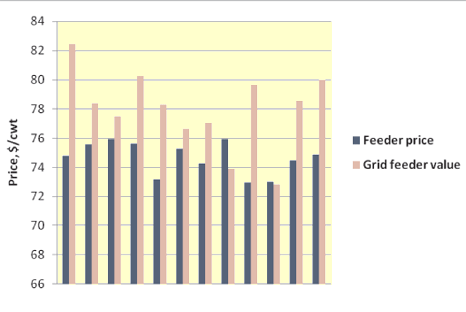
Figure 2. Feeder Cattle Market Prices and Grid-based Values by Ranch
Source: Mississippi Farm to Feedlot Program data, 1993-2002.
Analysis of Mississippi Farm to Feedlot program data for 2,322 calves enrolled in the program from 1993 to 2002 revealed that the average grid-based value of individual calves was significantly higher than the average market value of individual calves. Yet the difference between grid-based feeder calf value and market value can vary significantly from ranch to ranch. Similarly, the level of variability in grid-based values can differ widely from ranch to ranch. Retained ownership with grid pricing may be more beneficial for some ranches than others.
A working knowledge of how management proto- cols at the stocker and cow-calf levels change eventual carcass attributes and value is essential regardless of whether or not cattle ownership is retained through a finishing phase. Uncertainty related to feedlot per- formance, final carcass merits, and fed cattle prices contributes to significant risk premiums in the feeder cattle market. Producers of cattle with known feedlot performance and/or carcass potential may be better off retaining cattle ownership or marketing cattle in a way that communicates performance potential infor- mation directly to the buyer. Producers who provide this information to potential buyers position them- selves to be rewarded for producing a desirable prod- uct. For more information on fed cattle marketing or related topics, contact an office of the Mississippi State University Extension Service.
June 2009


