

The Economics Behind The Cow
It’s inevitable that cow/calf producers will continue to see increases in the cost of production for their operation, according to R.S. Walker, University of Minnesota Extension, Andover.
Cow/calf producers across the US have seen an increase in cost of production due mainly to the rise in feed, fuel, and fertiliser while seeing weak calf markets. While any cow/calf producer knows that production cost are on the rise, how many actually know what their own production cost are.
How many producers can actually say how much it cost to raise a calf, what is their winter feeding cost, or do they even have an idea on what their direct expenses are for the year. It is easy to figure out what income a producer is bringing in, but often times tougher to formulate direct and overhead expenses per cow/calf pair.
One of the most detailed tools that producers have to compare cost of production in the state of Minnesota is the Farm Business Management Annual Reports that are put out by the Northland Community College and Central Lakes College in Minnesota. The Farm Business Management annual report provides a detailed livestock enterprise analysis for beef cow-calf operations.
If you look at the annual reports for the last five years (Table 1), you will see that while cost of production (total direct and overhead expenses, w/out labor and management) per cow/calf pair increased $129.69 over the last five years, net return also decreased $281.44 for all 119 herds.
The same trend is seen with producers that fall into the top 20 per cent in net return where cost of production increased $174.99 and net return decreased $247.30 per cow/calf pair. The significant decrease in net return was in part attributed to the decrease in market prices for calves since 2006. This low in calf market prices has not shown any sign of rebounding, nor has fat cattle prices. While producers have little, if any, impact on market prices, some management practices can be employed to reduce the cost of production.
If we look deeper into Minnesota Farm Business Management’s most recent data (2008 Annual Report) on 119 farms, we can evaluate differences for producers that fall in the top 20 per cent for net return compared to the average of all farms. Table 2 gives more detailed information about differences in production between producers that fall in the top 20 per cent versus the average of all farms. While we evaluate the data in Table 2, what stands out the most is the difference in average weaning weight and feed cost per cow. With a difference in 33 pounds of calf weaned and the market price listed at $100.94/cwt, producers that fall in the top 20 per cent had a profit of $33.31 over all producers combined. If you look at the difference in feed cost per cow, producers in the top 20 per cent had a $51.39 /cow advantage in feed bill.
Combine those two together and the producers in the top 20 per cent had a difference in cost and revenue that equaled $84.70/cow. Today, that is a big number when we are dealing with high production cost and weak calf markets. Evaluating those two areas, there are obviously differences in feeding management to reduce feed cost per cow, as well as genetic differences to report a 33 lb advantage.
Table 1: Total direct and overhead expenses for MN beef farms from 2004 to 2008 reported by the Minnesota Farm Business Management Annual Report.

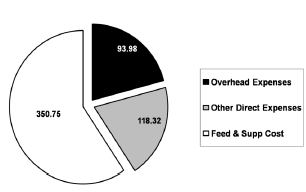
If we broke the total cost down (from the 2008 Annual Report) to determine total feed and supplement cost, it would be $350.75, which is over half of the total cost (Figure 1). Of that feed and supplement cost, summer feed and pasture cost make up approximately 15 per cent, or $52.61. So a large portion of production cost comes from winter feed and supplement cost, approximately 53 per cent of the annual cow cost. The more feed you have to provide to that cow during the winter months, the more cost of production goes up/head.
Table 2: Additional information provided for producers enrolled into the 2008 Minnesota Farm Business Management Program.

As the rise in production cost have weighed in on the pockets of most producers over the last couple of years, producers have started to look at ways of reducing production cost by adjusting winter feeding strategies with alternative feeds or by-products, utilizing alternative feeding systems, and extending the grazing season. Some of these practices can help to reduce overall production cost, but not all producers can realize these advantages depending on location.
Proximity of some of these alternative feeds or by-products, change in market prices due to market demand, weather conditions or disease outbreaks, or weather conditions affecting forage production can all affect one’s ability to utilize these alternative practices. Most production changes today focus on cutting the corners in those areas. However, there are areas of management that offer opportunities to reduce production cost in a cow/calf operation. These include extending the grazing season, managing to reduce DM loss, or cow size.
Extending the Grazing Season
The relatively short forage growing season (approximately 120 days) in northern Minnesota limits available forage growth and therefore number of fall grazing days. The short grazing season increases the requirement for harvested forages or supplemental feed which comprises approximately 60 per cent of all production expenses for beef cow/calf producers (Koch et al., 1997). Utilizing cool-season annuals in grazing systems can increase the amount and quality of available forage for grazing later in the season (Haferkamp et al., 2005).
To reduce winter feeding expenses, systems that employ animals to harvest forages longer into the grazing season are explored (D’Souza et al., 1990). Stockpile grazing is a fall grazing strategy used throughout the US while windrow grazing is typically used in Western US and Canada by beef producers to increase the number of total grazing days each season. While these strategies can reduce the cost of processing and feeding hay by as much as 60-75 per cent (Surber et al., 2001), weather impacts, such as rain or snow accumulation, are unpredictable in the Upper Midwest and may have a significant impact on forage quality, forage utilization, and subsequent animal performance.
Fall grazing systems, such as stockpile and windrow grazing, can provide opportunities for more producers to graze beef cows longer in the fall and consider backgrounding in MN. Two years of previous research at North Central Research & Outreach Center (NCROC) in Grand Rapids, MN evaluating effects of grazing windrowed vs. stockpiled annual ryegrass on pregnant, non-lactating beef cow performance suggests cattle can graze later into the fall season (December) while maintaining body condition or gaining bodyweight (Walker et al., 2007, 2009).
Forage quality in both systems was retained to meet or exceed nutrient requirements for maintenance of these cows (NRC, 2000). A study conducted in 2006 reported that the average cost to windrow graze a pregnant, non-lactating beef cow in the fall on two different forage varieties experiments was approximately $0.45/hd/day vs $1.13 for cows fed baleage of the same forage varieties (Walker et al., 2007). Those savings can add up significantly when managing your pastures for fall grazing a large herd. For example, 50 cows grazing 30 days longer would add up to a savings of $1,020 in winter feed cost. If you were to double that by either number of cows or grazing days, those savings would double. Not only does extending the grazing season allow you to shorten your winter feeding days, but also saves in winter feeding cost.
Analyzing forage quality data from the last four years at NCROC suggest nutrients provided in both stockpile and windrow annual ryegrass systems would meet or exceed nutrient requirements of 550 lb calves (Beef NRC, 2000). This would allow for backgrounding calves, post-weaning, for an extended period of time before going to market or directly into the feedlot. By utilising fall grazing options for backgrounding calves offers multiple advantages: efficiently putting weight on calves at a low cost to take advantage of selling more weight at market, or efficiently putting weight on calves prior to going into the feedlot to reduce feed cost.
Managing to Reduce DM Loss
We often don’t think about winter feeding management in terms of dry matter offered, feedstuff storage, or feeding waste reduction, but rather how long will the winter be this year, can I buy hay needed at a cheap enough price, or can I add any by-products to my winter feed at a cheaper cost.
Based on values derived from field research, a 100-cow operation in Minnesota that sells calves at weaning has a prorated minimum DM requirement of 6,600 lbs per brood cow. This will include total requirement needs of all animals within the herd. However in contrast, the 2008 Minnesota Farm Business Management Reported the average Minnesota cow/calf operation spent 8,307 lbs of DM per brood cow, showing a difference of 1,700 lbs. While most of that may be accounted for with increase DM intake for cattle that are in a less than desirable body condition, or for accounting for the extreme cold days during the winter, there is likely extra DM that is fed, yet not needed. By knowing the nutrient requirements of the cows you are feeding and the quality of the feed, you can prevent from overfeeding and save money.
Storage loss is responsible for much of the DM loss (up to 60 per cent of harvested material) from harvest to feeding it to the cows. Feed losses were similar for bales stored inside (12.4 per cent) or covered with plastic outside (13.4 to 14.5 per cent), but higher for bales stored uncovered outside (24.7 per cent; Buskirk et al., 2003). A study done at the University of Kentucky (Burdine et al., 2005) evaluated % dry matter (DM) loss from Five Hay Storing Methods:

Choosing a high and dry area to store feedstuffs is key because once moisture content of bales reaches 20 per cent, DM loss starts increasing dramatically. If hay bales exposed to the elements are positioned side by side, touching sides, or stacked in a pyramid (with no cover), moisture accumulation can lead to mold growth and DM loss. If you put a $ value on per cent DM loss, bales exposed to weather gets expensive! Table 3 (adapted from Oklahoma Cooperative Extension Service, Round Bale Hay Storage, http://osufacts.okstate.edu) below give you an idea of the value of hay lost in storage.
Storing hay on surfaces with good drainage such as crushed rock or pea gravel will prevent DM losses. An inline bale wrapper may be an option to consider if forage cost increases to greater than $64/ton. Indoor hay storage invariably leads to the least amount of DM loss. However, this option must be evaluated to ensure that the cost-to-benefit ratio is low.
Table 3. Per cent dry matter loss from round bales from inches of spoilage on the outer layer.

Feeding losses of DM also need to be avoided. A study conducted at the University of Michigan (Buskirk et al., 2003) determined the amount of waste by feeding hay in various structures: a cone feeder, bale ring, hay wagon, or cradle feeder. Feeding through a cone feeder yielded a 3.5 per cent waste, while a bale ring led to 6.1 per cent waste, and the hay wagon and cradle feeder led to 11.4 and 14.6 per cent waste, respectively.
The University of Minnesota recently completed a study evaluating feeding methods and amount of waste. Shredded hay was fed in a bunk or on the ground while whole baled hay was placed in a ring or rolled out on the ground. Results showed that shredded hay fed in a bunk resulted in 2.5 per cent waste, while hay bales fed in a bale ring led to 6.9 per cent waste. In contrast, shredding hay on the ground or rolling a whole bale out led to 18.2 and 19.6 per cent waste, respectively. There would be a 14 per cent loss of hay by feeding in a structure vs. no structure. When hay is priced at $73/ton, the resulting savings would be $4,358 for a 100 hd cow herd.
It is a good reminder that we need to evaluate various feeding segments of our operations. Try and select one thing a year that can be done to reduce loss of DM and save money. It all starts with getting your feedstuffs analyzed and feeding the correct amount of DM at 2 to 2.2 per cent of BW to meet a cow’s needs during the winter without over feeding.
Cow Size
The subject of “cow size” has received some attention over the past several years and recent data has shown that cow size will affect the efficient use of forages produced or feed purchased and its relationship to percent of body weight weaned. There is nothing complicated about the term cow size, but has allowed us to think about cow efficiency in the herd.
There are a number of factors that control efficiency of a cow in the herd, unlike feeding feeder calves in a feedlot, such as feed/forage composition, feed delivery or grazing method, feeding or grazing environment, breed, age, genetics, stage of reproduction, and weather. Controlling all of these factors is almost impossible; however, some of these factors are controllable in the cow herd and in fact are part of the reason why cow size has drawn some attention. Beef cow size, as we refer it, is a mature cow’s body weight (five years of age or older) at a body condition score of five. Body condition score is a subjective measurement of a beef animal’s nutritional status based on fat composition. Body condition scoring uses a numerical numbering system from 1 to 9 (1=emaciated and 9=obese).
Cow size can affect the efficient use of forages, amount of feed purchased, and amount of feed waste during the winter months. Within an average herd size of 1350 pounds, a herd will have a variation of cows that weigh above 1350 and below 1350 pounds and we often don’t think about how much more those heavier cows eat. If you use the example of a light bulb, a 100-watt bulb will use more energy than a 60-watt bulb. Same with cows, larger cows require more energy (in pounds) than smaller cows. To quantify how much more these bigger cows need, we will use DM intake as the easiest way to measure energy. As you know, larger cows require more energy for maintenance than smaller cows and during the grazing season, this is accomplished with a higher DM intake of forages. However, during the winter months when we dictate how much a cow needs, are we compensating for those heavier cows?
If the objective of our cow calf operations is to produce a calf that weighs between 550 and 650 pounds at 7 months of age of a quality and type to fit into our growing and finishing systems as economically as possible, then how does mature weight of the cow impact that objective? One would logically expect that larger cows are more capable of producing larger calves rather than small cows, but at what cost?
Researchers at the Dickenson Research Extension Center in North Dakota reported average mature cow weight of their herd was approximately 1422 lbs. Splitting the herd in half, the lighter cows averaged 1272 lbs and the heavier cows averaged 1571 lbs. They reported that calf weaning weights for the two groups were 602 and 603 lbs, respectively. With a 299 lb difference in mature cow body weight between the two cow weight groups, there was only a 1 lb difference in calf weaning weight between the two groups. Researchers in North Dakota also reported average daily dry-matter intake requirements of the two groups of cows was 28 (1272 lb cows) and 34.5 (1571 lb cows) lbs dry matter/cow/day. That breaks down to feeding those cows approximately 2.2% of their body weight in pounds of dry matter. That’s a difference of 2,373 lbs of DM/cow/year, or a little over a ton of hay/cow/year between the two weight groups.
If current market prices for 600 lb calves were $1.00/lb and we figured the cost of feeding only hay at $75/ton DM for the course of the winter (210 days), the one lb increase in calf weaning weight would not cover the cost of feeding the additional 299 pounds. To break it down further, the difference in daily dry matter intake/cow is 6.5 lbs, or 1.83 pounds per day additional dry matter intake for each 100 pounds increase in body weight. Factoring in the additional cost to feed those heavier cows and the small increase in calf weaning weight from those heavier cows over the lighter cows, there would be a net loss of $-53.60/hd/year for all cows that fall into the heavy weight group.
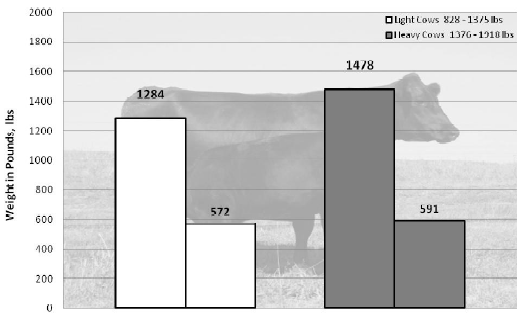
However, based on data from the Northwest Minnesota Beef Improvement Program (BIP), most herds showed an increase in calf weaning weights from dams in the heavy weight group. In 2009, 1148 cow/calf pairs across nine herds were weighed reporting an average mature cow weight of 1375 lbs. When all cows were broken down into a light and heavy weight group, the lighter cows averaged 1284 lbs and the heavier cows averaged 1478 lbs with their respective calf weaning weights of 572 and 591 lbs (Figure 1).
Based on these figures, difference in cow and calf weights were 194 lbs and 19 lbs, respectively. If we use the same values as the North Dakota data above with hay prices at $75/ton DM and market prices for a 600 lb calf at $1.00/lb, there would be a net loss of -$5.44/cow. Based on these reported data, cow efficiency is poorer in the heavier cows. However, within herd data from the BIP indicates that if cows are sorted based on percent of mature body weight weaned within 100 lb weight groups, mature cow body weights are similar yet there is a large variation in calf weaning weights within each 100 lb weight group suggesting there are greater inefficiencies in cows within each weight group. These inefficient cows in each 100 lb weight group can have a much greater negative net return over all cows that may fall into a heavy vs light weight group.
The 2000 NRC handbook indicates that DM intake increases three pounds/day for every 200 lb increase in mature body weight for a cow that produces 20 lbs of peak milk. Just based on feeding cows hay alone during the winter for 210 days at $75/ton DM, for every 100 lb increase in BW, it would cost an additional $12.60/cow/year. In fact, Dr. Bryan McMurry (2009) reported at today’s prices for hay, supplement, and mineral it is estimated that for every 100 pound increase of mature weight an additional $15-$20 is required per year in costs for those three inputs alone.
Summary
The most important piece of information for a cow/calf producer is knowing the cost of production. Again, it is not difficult to figure out the profit generated in one year; however one has to know the direct and overhead expenses to determine the net return for the year. By knowing the net return, one can evaluate and change management practices to accommodate any losses or any projected losses. There are certain areas in a cow/calf operation that can have a significant impact on profit/loss, strictly by reducing the cost of production. So consider these three things next year: extending the grazing season, managing to reduce DM loss, and cow size.
June 2010
