Comparing Current and 1970 Farm Prosperity: U.S. Livestock Production
In a comparison of farm prosperity between 1970 and today, Carl Zulauf and Nick Rettig of the University of Illinois note that prosperity has led to production expansion in recent years and underline the considerable stress that livestock farming has been put under from rising feed costs and the birth of crops for fuel. 9 July 2013
 8 minute read
Overview
This post is the sixth in a series that contrasts and compares the current period of farm prosperity with the farm prosperity of the 1970s. Its focus is U.S. production of livestock and livestock products during these two periods. Previous posts in this series are available here, here, here, here, and here.
Analysis
U.S. production of beef, pork, poultry, eggs, and milk is examined. Beef and pork production consists of commercial plus on-farm production. Poultry production is federally inspected production of broilers, turkeys, and mature chickens. Except for eggs, production data are from U.S. Department of Agriculture (USDA), National Agricultural Statistics Service (NASS) Quick Stats (here). Egg production is from USDA, NASS's Agricultural Statistics Annual (here). USDA's June World Agricultural Supply and Demand Estimates (here) is the source for current production. Also examined in this post is the cost of producing milk by size of the dairy herd. Source for this data is USDA, Economic Research Service (here).
As with most posts in this series, a benchmark average value is calculated for 1968-72 and 2001-05. These periods predate the 1970 and current period of farm prosperity, respectively. Five year averages are used to dampen the variability that can exist if a single year is used as a benchmark. Projected livestock production values are available for 2013, the 8th year after 2005. The 8th year after 1972 is 1980. There is no definitive way to decide when to start the period of prosperity or what period to use as a benchmark, but our choices are reasonable. While the current period of prosperity is still on-going, 8 years is long enough for an initial comparison.
Meat Production
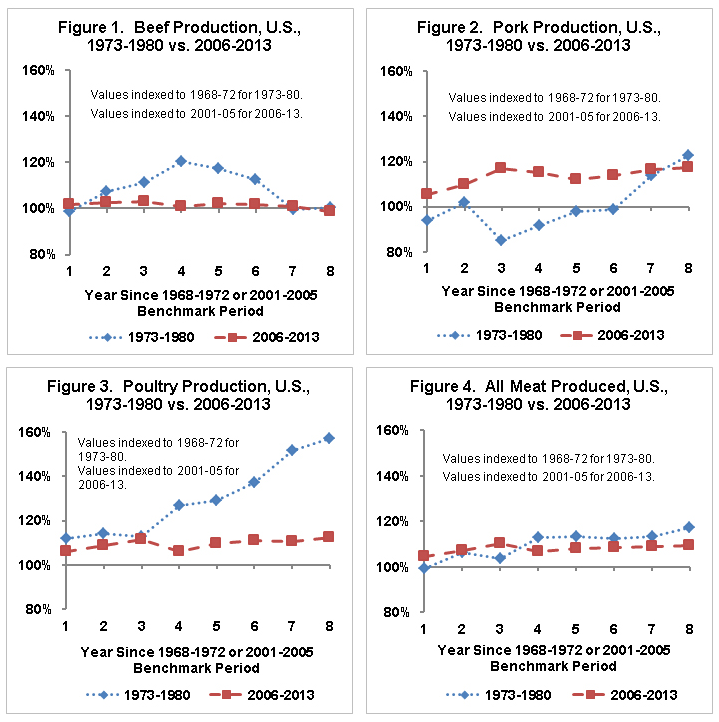
Compared with average production in 2001-05, forecasted production for 2013 is slightly lower for beef (-1%) but higher for pork (+17%), poultry (+12%) and all meat (+9%) (see Figures 1-4). Production in 1980 also was generally higher than in 1968-72, with beef again having the smallest change. Pork production has increased faster since 2001-05 than over the entire period since 1968-72 (+2.1% per year vs. +1.8% per year). In contrast, the average annual change since 2001-05 is smaller than since 1968-72 for beef (-0.2% per year vs. 0.4% per year), poultry (+1.5% per year vs. +9.5% per year) and all meat (+1.2% per year vs. +2.6% per year).
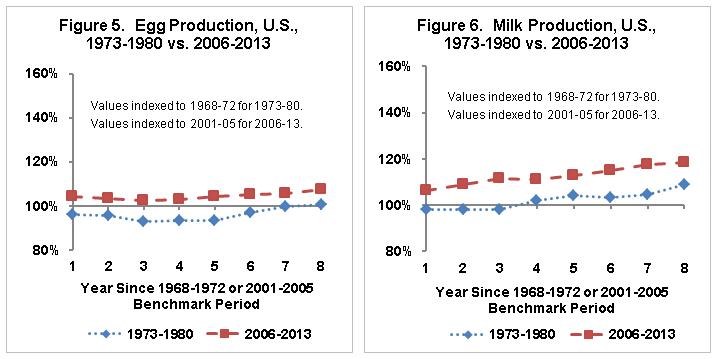
Egg production during the current period of farm prosperity has consistently exceeded both its 2001-05 benchmark amount and the change in egg production during the 1970 farm prosperity relative to its 1968-72 benchmark value (see Figure 5). Moreover, egg production has increased at the same annual rate since 2001-05 as since 1968-72 (+0.9% per year).
Like egg production, milk production during the current period of farm prosperity has consistently exceeded its 2001-05 benchmark amount and the rate of change during the 1970 period of prosperity (see Figure 6). Milk production has increased faster since 2001-05 than since 1968-72 (+2.3% per year vs. +1.7% per year).
Production Stability
Figures 1-4 suggest that year-to-year changes in livestock production generally have been smaller during the current period of farm prosperity than during the 1970 period of prosperity. Consistent with this visual suggestion, standard deviation of annual production changes, a common statistical measure of variation, was at least 50% lower during the current period of prosperity. The reasons for this increased stability in livestock production are not known, but a factor could be the large decline in number of livestock producers. For example, the number of farms in the 1974 (2007) Census of Agriculture (here) was 53,435 (27,091) for broilers, 470,258 (75.442) for hogs and pigs; 304,823 (145,615) for layers; and 403,754 (69,890) for milk cows. The farms that have remained in livestock production likely reflect, in part, a strong commitment to livestock production; otherwise, they would have exited. In addition, current livestock farms average a larger number of animals, which implies a greater financial commitment to livestock production. The net result is that current livestock producers are probably less likely to stop or reduce production when profits come under pressure.
Cost Economies of Size
The increase in production of meat and livestock products since 2001-05 is not consistent with the livestock sector's rhetoric of difficult economic times. There is no question that higher feed prices, given that everything else remains the same, reduces livestock sector profits. However, in markets, it is rare that everything else remains the same, particularly over time.
During the 1970 period of high crop prices, production of most meat and livestock products also increased. In particular, poultry production in 1980 was 57% higher than in 1968-72. The rapid growth in poultry production during the 1970s is commonly attributed to poultry's efficient conversion of feed into meat relative to other animals and to the emergence of new technologies that notably reduced the cost of producing broilers at larger flock sizes. Reflecting the latter, average inventory of broilers and other meat type chickens per farm was 116,831 in the 1982 Census of Agriculture, compared with 19,566 in the 1969 Census. In summary, cost savings related to larger size swamped the impact of higher feed prices, causing broiler production to expand rapidly.
Cost economies of size continue to be a key factor in the U.S. livestock sector. USDA reports annually the cost of producing milk by number of cows per farm. Similar annual data are not available for other livestock. Nevertheless, examining milk production by herd size is instructive because, among the meat and livestock products examined in this article, milk production has increased the most since 2001-05 (+18%). Pork production is a close second at +17%.
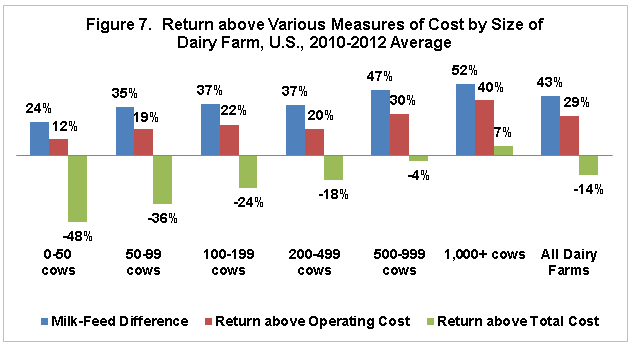
As Figure 7 illustrates, return over cost for the 3 most recent years of data generally increases as the dairy herd increases in size. This holds true for all 3 measures of returns: milk price relative to feed cost, total return relative to operating cost, and total return relative to total cost. Herds of 1,000 or more cows are the most profitable, especially when measured on a total cost basis. They are the only herd size with a positive average return above total costs over 2010-12 (+7%). In comparison, average return above total costs for all dairy farms is -14%. Thus, while the average dairy farm was unprofitable over 2010-12, the average dairy farms with 1000 or more cows was profitable. This discussion implies that, despite high feed prices, milk production could increase if production on the largest dairy farms increased faster than milk production declined on the other dairy farms.
Consistent with the existence of notable economies of size in milk production, the 2007 Census of Agriculture reported that dairy farms with 1000 or more cows accounted for 41.8% of all dairy products sold by U.S. farms, up from 30.9% of sales in the 2002 Census. It is also worth noting that the 2007 Census reported that 478 dairy farms had 2,500 or more cows, accounting for 22.5% of all dairy products sold by U.S. farms.
Summary Observations
U.S. production of all meat, eggs, and milk are projected to be higher in 2013 than before the current period of farm prosperity began. In general, the same observation applies to the comparable year of 1980 during the 1970 period of farm prosperity. Furthermore, production of milk and pork has grown faster since the current period of farm prosperity began than over the entire period since 1968. These production responses occurred despite the sharp increase in feed prices. In short, the story of the U.S. livestock sector during the current period of farm prosperity is more complex than simply a story of increasing crop prices.
As this article has discussed, a key factor in understanding the larger story at work is likely to be cost economies of size and the resulting shift to fewer, larger livestock producers. In particular, the existence of economies of size means that the largest livestock producers can earn a profit even when the average return for all livestock producers is negative. By extension, it is therefore possible for production to expand even when the average producer is losing money.
While not discussed in this article, it is important to point that U.S. per person consumption of all meat measured at the retail level has declined during the current period of farm prosperity: from 219.5 pound per person during 2001-05 to a projected 204.8 pound per person in 2013. This decline in domestic consumption has been more than offset by an increase in U.S. exports of meat. The same set of observations applies to eggs. For milk, both exports and per capita U.S. consumption have increased since 2001-05. Thus, part of the more complete story about the U.S. livestock sector during the current period of farm prosperity is its shift to a more export orientation.
In conclusion, at least as of year 8 of the current period of prosperity, the U.S. livestock sector has, in general, continued to expand production. Obviously, the period since 2005 has been difficult for many livestock producers. The likely reconciliation of the apparent conflict between financial stress for many livestock producers and the observed increased in livestock production is cost economies of size that is causing production to shift toward ever fewer, ever larger livestock producers. Higher feed costs and expanding ethanol production may have exacerbated the stress associated with this structural shift in U.S. livestock production, but they are not likely the root cause. Last, the continued expansion of the U.S. livestock sector in a period of high feed costs bodes well for domestic livestock feed demand when crop price declines occur in the future.
In the next post in this series, we will examine the growth in demand in China.
Issued by Carl Zulauf and Nick Rettig
Department of Agricultural, Environmental and Development Economics
The Ohio State University
For More Info Click Here.