

Estimated Performance Of Irish Cattle Farms In 2010
James Breen and Kevin Hanrahan from Teagasc, look at the estimated performance of Irish cattle farms in 2010, including estimated input usage and prices, and estimated outputs.This section of the paper presents a review of the economic performance of Irish cattle farms in 2010. A discussion of the estimated changes in input usage and input costs is first presented and a discussion of estimated changes in output value in 2010 follows. The estimates of margins earned by the different cattle enterprises in 2010 are then presented.
3.1 Estimated Input Usage and Price 2010
3.1.1 Feedstuffs At the time of writing (December 2010), three quarterly bulletins of official Department of Agriculture, Fisheries and Food (DAFF) data on the quantity of beef compound feed sold were available for 2010. For the first nine months total compound beef feed sales was approximately seven per cent higher than for the equivalent period in 2009. The very cold weather in the final quarter of 2010 may have led to some increased feeding of concentrates, but it is unlikely that the change in that quarter relative to 2009 will dramatically alter the picture for 2010 as a whole. The volume of feed purchased in 2009 is estimated to have increased by 8 per cent on the 2009 level.
Figure 1 illustrates the evolution of monthly beef feed prices over the period January 2007 to October 2010. Cattle feed prices were relatively stable in the first 6 months of 2010, and were over 12 per cent lower than for the equivalent period in 2009. Feed prices increased in the third quarter and increased further following the main cereal harvest period. Nevertheless over the first 10 months of 2010 the average price level was over 7 per cent lower than in 2009. Feed prices continued to rise through the final quarter of 2010 and taking a weighted average for the entire year, a decline of 5 per cent in the price of beef concentrate feed is estimated.
Figure 1: Monthly Price of Cattle Fattening Nuts and Cubes (13- 15% Protein) in Ireland for 2007 to 2010
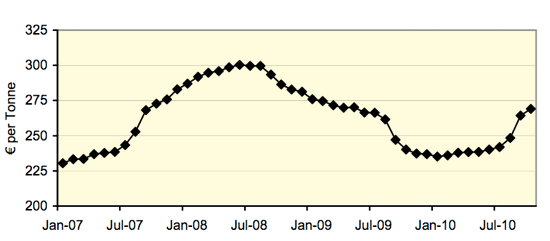
With volumes fed anticipated to have increased by 8 per cent and the average feed prices down 5 per cent, this is indicative of a small increase in total expenditure on feed by beef farmers in 2010 compared with 2009.
3.1.2 Fertiliser – usage and price 2010 Data from the DAFF indicate that total sales of nitrogen, phosphorous and potassium in 2010 were significantly higher than in 2009. Sales of nitrogen in 2010 were 18 per cent higher than in 2009, while sales of phosphorous and potassium were 45 per cent and 35 per cent higher respectively. Most of the increased use of fertilisers is expected to have occurred on dairy and cereals farms. In 2010 recovering milk prices drove an increase in milk output and this was reflected in increased applications of fertiliser. The only marginal improvement in cattle output prices in 2010 means that, despite lower fertiliser prices, usage of fertiliser on Irish cattle farms is not estimated to have changed significantly in 2010. For 2010 we estimate that fertiliser usage by Irish cattle farms will be five per cent higher than in 2009.
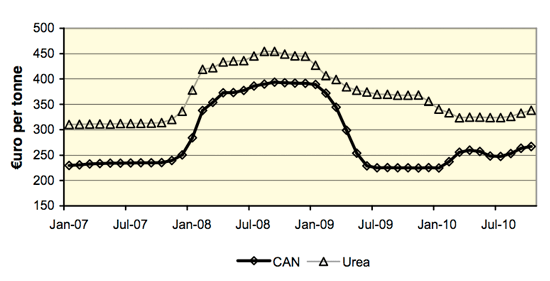
As can be seen from Figure 2, following the rapid decline in prices in the first two quarters of 2009, fertiliser prices have been relatively stable in 2010 at price levels close to those experienced prior to the dramatic increase in prices experienced in 2008. However, in the latter half of 2010 prices for CAN and Urea started to increase. Most fertiliser purchases made by Irish cattle farmers are likely to have occurred in the first half of the year, thus comparing spring 2009 and spring 2010 fertiliser prices gives a better idea of how Irish cattle farmers’ fertiliser expenditure has developed in 2010. From such a comparison the price of CAN in 2010 is approximately 20 per cent lower, while the price of urea is approximately 17 per cent lower. Overall, we estimate that fertiliser expenditure by Irish cattle farmers in 2010 has declined by 13 per cent relative to expenditure in 2009.
Figure 2: Monthly Price of CAN and Urea from 2007 to 2010
3.1.3 Energy and Fuel – usage and price 2010
2010 has seen global oil prices increase from $74 per barrel (pb) on average in Jan 2010 to reach $83 pb in December 2010. The average price for 2010 was €76 pb. Over the course of 2010 the euro weakened versus the US dollar which means that the extent of the per centage and absolute crude oil price increase relative to 2009 was larger when expressed in euro terms. The average crude oil price for 2010 in euro was €58, an increase of 32 per cent on the 2009 value of €44 pb. A carbon tax was introduced by the Irish Government in mid 2010 and this also increased fuel prices in Ireland. Overall, as a result of rising crude oil prices, a weakening of the euro against the US dollar and the introduction of the carbon tax, fuel costs in Ireland have increased significantly, with diesel prices approximately 17 per cent higher in 2010 than in 2009.
With the increase in diesel prices in 2009, it is anticipated that agricultural contracting charges will also have increased. We have estimated that contracting charges will be 5 per cent higher in 2010 than in 2009. Given that most of the contractor work on cattle farms involves making silage and applying farmyard manure and artificial fertiliser, there is very little scope to reduce the “volume” of contractor services consumed if prices rise. Consequently, no further decline in expenditure as a result of a volume change is assumed and therefore the estimated 5 per cent increase in price is reflected in an increase in expenditure on contract work.
Electricity costs change infrequently in Ireland due to price regulation. The most recent price change was a decrease in October 2009 and prices have been unchanged through 2010. On an annual average basis this means that prices have fallen by about 6 per cent in 2010, relative to 2009. Given that no change in volume consumed is assumed to have occurred in 2010, expenditure on electricity on cattle farms is estimated to have decreased by 6 per cent in 2010.
With the continuing weakness of the Irish labour market in 2010 (reflected in rising unemployment and falling wages), agricultural wage inflation was unlikely. Despite increased availability of family labour (due to reduced off- farm opportunities) we estimate that the volume of hired labour used by Irish cattle farms will not decline relative to 2009 and that expenditure on labour on Irish cattle farms in 2010 will have been unchanged relative to 2009. Other direct costs include the value of milk and milk substitutes fed to calves and this cost is estimated to have increased significantly in line with the general improvement in milk prices seen in 2010. The cost of other overhead (fixed) costs is estimated to have decreased by two per cent in 2010 compared with 2009, reflecting the general economy wide price deflation experienced in 2010. Given the largely fixed nature of overhead costs, there is little capacity for changes in volume used, and no change in volume or usage is assumed in 2010 compared to 2009.
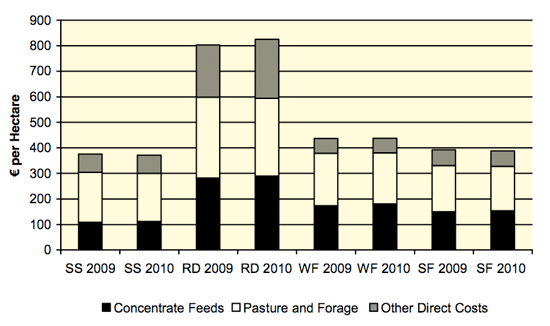
3.1.5 Estimate of Direct Cost Expenditure for 2010Figure 3 compares the average direct costs of production for the four featured production systems in 2009, with the estimated direct costs for 2010. Average direct costs on three of the four production systems are estimated to have declined slightly relative to their level in 2009. The decrease in direct costs of production on these farms in 2010 is estimated to have been driven primarily by lower fertiliser and feed costs. Direct costs on RD farms are estimated to have increased in 2010. This increase is partly the result of the strong recovery in milk prices that is estimated to have increased the cost of milk fed to calves on these dairy farms. Overall, the reduction in direct costs from 2009 to 2010 on the single suckling, weanling to store/finish and store to finish production systems is less than €6 per hectare.
Figure 3: Comparison of Actual 2009 Direct Costs and Estimated 2010 Direct Costs for main Cattle Systems
3.2 Estimated Output Values 2010
Ireland exports over 80 per cent of its beef production and is the fifth largest exporter of beef in the world. The export dependence of the Irish beef industry means that external market developments largely determine Irish cattle prices. Thus, conditions in the particular overseas markets to which Irish beef and cattle are exported play an important role in determining Irish cattle prices.
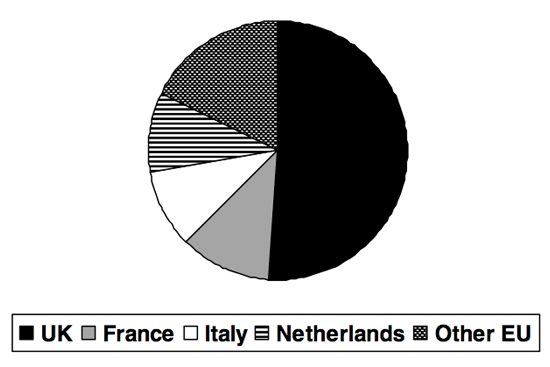
The UK remains the largest market for Irish beef (see Figure 4). The end of the recession in the UK in Q1 2010 has led to some weak recovery in demand for beef in the UK. Since Irish beef exporters are price takers, this means that the appreciation of the pound sterling versus the euro over the course of 2010 was a factor in the slightly increased level of Irish cattle prices in 2010. Despite the stronger economic performance of most other EU Member States, cattle prices on most other EU markets were on average lower in 2010 than in 2009. The prospect of exports of beef to non- EU markets such as Turkey, which reduced the tariffs it places on imports of beef in response to large increases in internal prices in 2010, and the continuing restrictions on imports of beef from Brazil suggest that both EU and Irish cattle prices should improve in 2011.
Figure 4: Composition of Irish Beef Export to EU (Volume) 2010
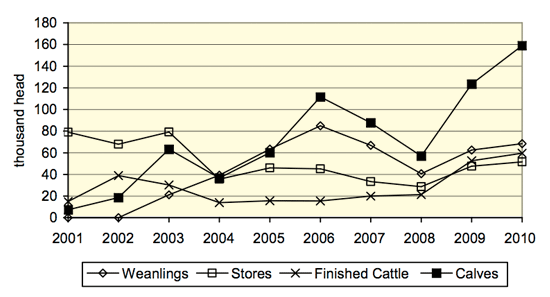
In 2010 live exports of cattle from Ireland continued to increase, though the magnitude of the annual increase in 2010 (18 per cent) was less than that observed in 2009. A buoyant live export trade continues to be an important source of demand for Irish cattle output. Most of the growth in live exports in 2010 was in calf exports, which increased by 35 per cent in 2010 on the 2009 levels. This reflects the ongoing change in the composition of Irish live exports noted by Breen and Hanrahan (2010) and illustrated in Figure 12.
Figure 5: Irish live cattle Exports (2001 – 2010)
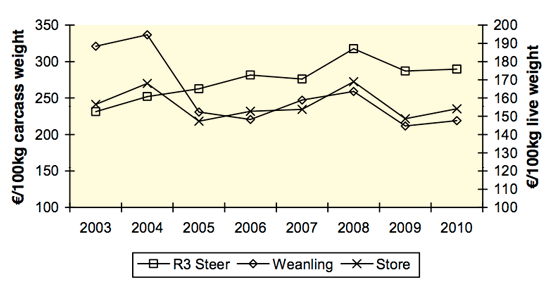
Trends in Irish cattle prices in recent years are presented in Figure 6. In 2010 Irish cattle prices increased relative to 2009. Finished cattle prices (R3 steer) increased by just under 2 per cent to €291/100kg. The price of weanlings and store animals has also increased, with the Irish price of weanlings in 2010 approximately two per cent higher than in 2009 and while the price of store bullocks was approximately 3 per cent higher in 2010 than in 2009.
Figure 6: Irish Cattle Prices
3.2.1 Irish and EU Cattle Supply 2010
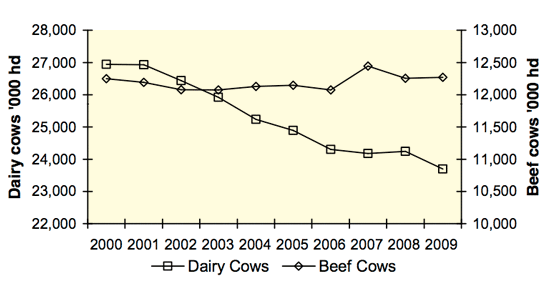
In the short term, some improvement in demand for beef is likely as the EU slowly recovers from the recent economic crisis. Indigenous EU supplies of beef are contracting due to the ongoing reductions in both the EU dairy and beef cow herds. In Figure 7, the recent trends in dairy and other cow stocks in the EU are presented. Over two-thirds of EU beef production is based on the offspring of dairy cows. In recent years the contraction in the dairy cow herd has exceeded that in the other (beef) cow herd, leading to a modest increase in the share of the EU cow herd that is non-dairy. Low returns from cattle production have led to some contraction in suckler cow numbers in the UK and Ireland and this contraction is expected to continue. In the absence of a policy reform that supports specialised beef production the decline in suckler cow numbers is expected to become more prevalent in the medium term in those EU Member States where the retention of coupled suckler cow premiums in has to this point supported beef cow numbers.
Figure 7: EU Cow Numbers (December) 2000 - 2009
3.2 Beef System Net Margin Estimates for 2010
Average gross output on all four of the selected beef production systems is estimated to have increased in 2010, see Figure 8. This increase is due to the slightly higher prices for cattle in 2010. The largest increases in output occurred on single suckling (SS) and dairy beef (RD) farms where output is estimated to have risen by approximately €12 and €37 per hectare respectively in 2010. The larger increase output on the dairy beef farms larely reflects the greater level of output per hectare on these farms. The largely similar magnitude of the change in finished cattle and weanling and store prices, as shown in Figure 5, mean that the change in the value of output on weanling to finish (WF) and store to finish (SF) farms was much smaller since improvements in the price of cattle sold off of the farm were offset by increased prices paid for cattle purchased in as weanlings and stores. Output on WF farms is estimated to have increased by €9 per hectare, while output on SF farms is estimated to be largely unchanged on the 2009 level.
Figure 8: Comparison of Actual 2009 Gross Output and Estimated 2010 Gross Output for main Cattle Systems
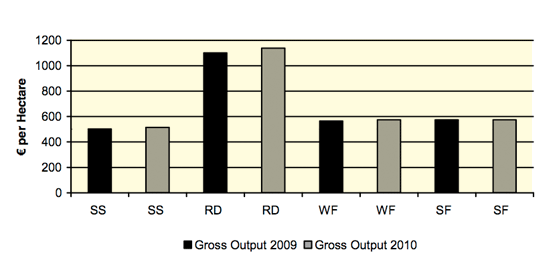
The small increases in the average gross output on cattle farms when combined with reductions in the direct costs of production is estimated to lead to improvements in the average gross margin earned on each of the four farm types in 2010. The improvement in gross margins, despite a small increase in overhead costs, is sufficient to lead to smaller average negative net margins across all four of the farm types. The magnitude of the losses (negative net margins) is estimated to be largest on WF and SS farms.
Table 1: Estimated Gross and Net Margins in 2010 estimated for the main Beef Systems
| Single Suckling | Dairy Beef | Weanling to Finish | Store to Finish | |
|---|---|---|---|---|
| euro per hectare | ||||
| Gross output 2009 | 502 | 1,101 | 565 | 575 |
| Gross output 2010 | 515 | 1,138 | 574 | 575 |
| Gross Margin 2009 | 125 | 298 | 129 | 195 |
| Gross Margin 2010 | 144 | 313 | 142 | 199 |
| Net Margin 2009 | -173 | -167 | -207 | -105 |
| Net Margin 2010 | -157 | -156 | -198 | -105 |
|
Source: National Farm Survey 2009 and Authors’ Own Estimates 2010.
|
||||
Table 2 breaks the cattle farm population into 3 equal parts on the basis of profitability (net margin) per hectare. For the least profitable one-third of cattle farms the average negative net margin is estimated to have improved marginally from -€442 per hectare to -€434 per hectare. In 2009 the average net margin on the most profitable one-third of Irish cattle farms was €64 per hectare in 2009 this is estimated to increase to €78 per hectare in 2010.
Table 2: Estimated Financial Performance per hectare for All Cattle Farms 2010 and Actual for 2009
| Least Profitable | Average Profitability | Most Profitable | All | |
|---|---|---|---|---|
| euro per hectare | ||||
| Gross Output | 633 | 517 | 700 | 614 |
| Direct Costs | 608 | 378 | 362 | 443 |
| Gross Margin | 25 | 139 | 337 | 171 |
| Overhead Costs | 459 | 290 | 260 | 332 |
| Net Margin 2010 | -434 | -151 | 78 | -161 |
| Net Margin 2009 | -442 | -162 | 64 | -172 |
|
Source: National Farm Survey 2009 and Authors’ Own Estimates 2010.
|
||||

