US Beef Outlook - August 2010
In 2010, 2.19 billion lbs of US beef are forecast to be exported, as exports to Japan and South Korea are providing the most momentum in the US beef export market, according to the USDA Economic Research Service (ERS) August 2010 Livestock, Dairy and Poultry Outlook. 24 August 2010
 11 minute read
The rate of exports to Viet Nam seen earlier in the year may decrease in the second half of 2010. Regardless, US beef exports should remain competitive in the global marketplace, particularly as the US dollar remains relatively weak vis-à-vis the currencies of competing exporters, particularly the Australian dollar.
Cow Herd Continues To Dwindle
While cattle cycles can be defined as total inventories of cattle and calves from trough to trough—as used here—or from peak to peak, the cattle cycle behavior that persists is largely due to dynamics in the beef cattle sector, since dairy cows have not exhibited cyclical behavior since about 1947. Other ways to look at cattle cycles are by cow inventories or by beef cow inventories. Each cycle consists of an expansion phase, a consolidation phase, and a liquidation phase.
Historically, and prior to the current cycle, the shortest expansion phase, of 3 years, occurred from 1980 to 1982 when inventories increased by 4 per cent from their low point. This expansion was followed by a liquidation that lasted 8 years from 1983 to 1990, during which, inventories declined by 17 per cent. The next cattle cycle peaked in 1996, increasing 8 per cent from its 1990 low—a 6-year expansion. This was followed by an 8-year, drought-extended liquidation that saw inventories decline by 8 per cent and left a 2004 cattle inventory about a million head lower than the January 1, 1990 trough. The shortest liquidation phase in historical terms occurred during the cattle cycle that began in 1959, peaked in 1965, and bottomed in 1967—a 2-year liquidation.
The expansion phase of the current cattle cycle began in 2005 and peaked in 2007, due in part to a short-lived upturn in dairy cow inventories. With the July 1, 2010 inventory report, US inventories of cattle and calves are 4 years into liquidation. If one looks solely at January 1 beef cow inventories, the decline that began in 1996 has been continuous except during 2005 and 2006. Declines in both July 1, 2010 beef cow inventories (down 1 per cent) and beef heifer inventories (down 2 per cent) suggest that a further decline is likely in store for 1 January 2011 beef cow inventories.
A number of factors drive inventory dynamics. Weather patterns, especially drought, can shift inventories into or extend liquidation of the cow herd. Profit margins can also affect retention or liquidation decisions. Current cow prices appear to be sending significant numbers of cows to slaughter, reducing the total cow inventory from its already low levels.
Increased demand for corn and other grains in international markets will also continue to play a role in feed grain price dynamics. Prices for energy and other inputs will likely increase, raising breakeven costs at all levels of the cattle and beef industries. These factors, combined with the much longer production cycle for beef cattle compared with other livestock species, enables producers of other species to more quickly respond to changes in demand for final meat and poultry products.
With current Cattle report estimates of the calf crop in 2010 below 2009 by more than 400,000 head, or 1 per cent, competition for feeder cattle in 2011 is expected to be severe. This competition could intensify if heifers are retained for replacements, further reducing feeder cattle supplies. Under such a scenario, feeder cattle prices would be well-positioned for significant support at higher levels.
1 July 2010 dairy replacement heifer inventories were up by 3 per cent. Given that the number of heifers for dairy replacement as a share of the cow herd was record high for July, we can anticipate continued dairy cow slaughter at relatively high levels.
Feeder Cattle Supplies Tight for Foreseeable Future
National Feeder and Stocker Cattle Summaries (SJ_LS850) indicate that feeder cattle sales have been well above year-earlier levels. At the same time, feeder cattle supplies outside feedlots, down by almost 3 per cent, are the lowest since the series began in 1996. Further, the latest Cattle On Feed report released 23 July indicated that the ratio of over-700-lb June feeder cattle placements to total placements was lower than last June's and almost the same as in 2008. Should these placement levels continue, the stage is set for heavy fed cattle marketings at the end of the year and into the first and second quarters of 2011.
With almost a million fewer feeder cattle outside feedlots on July 1, 2010 compared with 2009, cattle appear to be "pulled forward" (placed on feed earlier than would be considered typical) to take advantage of the current profit potential and to utilize feedlot pen space. Continued increases in grain prices could counteract the pulling forward of feeder cattle placements, which could be supportive for feeder and later fed cattle prices.
Mexico has been rebuilding its cow herd after a series of extremely dry years. As a result, Mexico should be in a good position to export feeder cattle to the United States. This will offset anticipated reductions in exports of feeder cattle from Canada where large numbers of cows going to slaughter will reduce this and next year’s calf crops, and thus, future feeder calf supplies.
Feedlot Picture Could Dim
Second-quarter 2010 net placements were 14 per cent above second-quarter 2009 placements and 6 per cent above 2008 placements. May-June 2010 placements could come to market in the fourth quarter in sufficient numbers to exert some downward pressure on prices. July placements have the potential to add further to winter marketings. Marketings for 4 of 6 months thus far in 2010 are above year earlier.
Currently forecast corn and soybean prices—combined with feeder cattle prices near historical highs—will result in fed cattle breakeven prices above current levels. Fed cattle prices at or above these levels could be difficult to achieve in the face of competition from cheaper poultry and a slow-paced economic recovery through the remainder of 2010, although lower pork supplies would provide positive price support. Small or negative cattle-feeding margins would result in some negative pressure on feeder cattle prices, adding to existing reluctance among cow-calf producers to expand cow herds.
Above-average summer temperatures have also negatively affected cattle feeding. In addition to some reported heat-related death losses, the extreme heat has resulted in reduced feed consumption by feedlot cattle, which negatively affects their performance, increases costs of weight gain, and contributes to the lower dressed weights observed thus far in 2010.
Increased cattle slaughter has not been sufficient to offset reduced beef production because of persistently lower dressed weights thus far in 2010. Dressed weights were down during the second quarter: cattle down 13 lbs (1.7 per cent), steers down 15 lbs (1.9 per cent), and heifers down 13 lbs (1.7 per cent). Through 14 August, 2010, year-to-date total federally inspected beef production is down by .6 per cent, with slaughter up by 1.3 per cent.
Despite July Choice beef cutout values being almost 11 per cent over year-earlier prices, packers were caught between relatively strong fed cattle prices (supported by feedlot marketings that are up to date (current)) and declining retail prices. Relatively high byproduct values, currently running about $2 per cwt higher than third-quarter 2009, and increased July farm-to-wholesale margins, up by 24 per cent, are providing some relief to packers. On the other hand, retail prices for Choice beef declined from 4.49 in June to $4.44 in July, about a 1-per cent decline.
Beef/Cattle Trade Summary
In 2010, 2.19 billion lbs of US beef are forecast to be exported, as exports to Japan and South Korea are providing the most momentum in the US beef export market. The rate of exports to Viet Nam seen earlier in the year may decrease in the second half of 2010. Regardless, US beef exports should remain competitive in the global marketplace, particularly as the US dollar remains relatively weak vis-à-vis the currencies of competing exporters, particularly the Australian dollar.
Imports of beef to the United States this year are forecast at 2.6 billion lbs, nearly even with 2009 levels. Cattle imports were strong through the first half of 2010, but weather and US prices should determine the strength of cattle imports in the second half of the year.
Good News-Bad News for US Beef Exports
US beef exports in 2010 are forecast at 2.19 billion lbs, growing 13 per cent above 2009 export levels. Japan and South Korea are adding the most momentum to exports of US beef. Growth in the third and fourth quarters of this year is anticipated at 17 per cent for Japan and 6 per cent for South Korea, year-over-year. The second quarter ended with 585 million lbs of beef exported, nearly 18 per cent above the same quarter last year. In the third quarter of this year, 580 million lbs of beef are forecast to be exported. In general, strengthening economies and the gradual return to pre-BSE export levels has resulted in growth in the Japanese and South Korean markets. Also, the relatively weaker dollar against the Japanese yen has given a boost to US beef exports to Japan. With moderate GDP growth and stable prices in Japan and South Korea, US beef exports for the first half of 2010 have returned to 33 and 45 per cent of pre-BSE levels (2003), respectively. Although these figures may appear meager after 7 post-BSE years, exports to Japan through June demonstrated a solid 24 per cent growth year-over-year (104 per cent for South Korea), and weekly data suggests the per centage growth will be equally strong into the second half of the year.
US beef exports to other major export markets in Asia also increased year-overyear through June: Viet Nam (+2.5 per cent), Taiwan (+48 per cent), and Hong Kong (+84 per cent). US beef exports for 2011 are forecast to decline 6 per cent from the 2010 total; this is due to lower beef production as the domestic cattle inventory declines.
Growth in US Beef Imports Anticipated in the Second Half of 2010
Imports of beef to the United States for 2010 are forecast at 2.6 billion lbs, fractionally below 2009 levels. Data from the second quarter showed imports to be at 690 million lbs–8 per cent below the year-earlier second-quarter total. Coupled with lower supplies in Australia, the strong Australian dollar is a factor that has continued to plague the US import market for Australian beef products, which, in turn, has put downward pressure on total US beef imports thus far in the year. Imports of Australian beef thru June were 40 per cent below year-earlier levels. Australia is also a primary competitor of the United States in the beef export market, particularly for markets in Asia (South Korea, Japan, and Taiwan), and the strong Australian dollar is an additional factor keeping US export products competitive in world trade. Beef imports from New Zealand were also down 6 per cent, and in lieu of these decreases from Oceania through June, more product is coming across the Canadian border. Imports from Canada were 14 per cent higher, year-over-year.
The third and fourth quarters should demonstrate beef import growth above yearearlier levels at 700 million and 640 million lbs imported, respectively; this would equal quarterly increases of 13 and 16 per cent, year-over-year. The increase in US imports should also be synonymous with gradually increasing beef supplies in Australia toward the end of 2010, a result of herd rebuilding that began earlier this year. US beef imports for 2011 are forecast to increase 7 per cent from the 2010 total. Tighter domestic supplies and greater availability of beef in the world market should rally imports next year.
Weather and Prices Will Determine the Strength of Cattle Imports in the Second Half of 2010
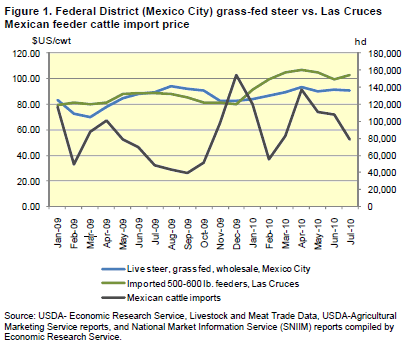
Cattle imports through June continued well above the historical trend, averaging 15 per cent higher year-over-year. Cattle imports from Mexico and Canada were 31 and 4 per cent higher year-over-year, respectively. The higher imports have occurred despite good weather and forage conditions in Mexico and Canada. For the first half of 2010, financial incentives likely have trumped the good grazing conditions in Mexico, as US feeder cattle prices—coupled with a fairly steady Mexican peso thus far in 2010— have raised the price Mexican cattle producers are receiving at the border. US prices have been well above the Mexican feeder cattle price equivalent since the beginning of this year (fig. 1).
Cattle imports from Canada are primarily fed cattle, as steer and heifer imports for immediate slaughter have averaged 63 per cent of Canadian cattle imports over the last 5 years. Through June, fed cattle imports are 23 per cent higher year-over-year. A higher US-Canadian price differential compared with years past has been the primary driver behind the increase in Canadian slaughter cattle imports. Additionally, the Canadian dollar has been relatively flat throughout the summer months. Imports of culled Canadian cows for slaughter are below year-earlier levels. Total imports from Canada of cattle greater than 700 lbs, which includes both slaughter steers and heifers, slaughter cows, and heavy feeder cattle, are 8 per cent higher year-over-year. Since the proportion of feeder cattle imported from Canada is typically small—averaging less than 12 per cent over the last 5 years for cattle less than 700 lbs—lower numbers of feeder cattle do not have as great an impact on total Canadian import statistics. Perhaps due to the good grazing conditions in Canada, producers have held back relatively more of their feeders this year. Canadian feeders imported in the 440-700 lbs weight range were 62 per cent of 2009 levels, year-over-year.
Further Reading
| - | You can view the full report by clicking here. |
August 2010