2010 US and World Agricultural Outlook
The slowdown in the world economy in 2009 proved to be deeper and more widespread than originallyanticipated, with an annual rate of real GDP growth of -1.9 per cent, according to the Food and Agricultural Policy Research Institute 2010 US and World Agricultural Outlook. 13 April 2010
 6 minute read
However, recovery is projected to begin in 2010, with long-term real GDP growth of 3.3 per cent reached by 2011. With the recovery primarily driven by a fiscal stimulus and restocking of inventory, its sustainability centers on how quickly and robustly confidence is restored and the employment picture is improved, leading to transition into private consumption and investment demand for medium to longer term growth.
Also, the economic recovery is accompanied by stronger energy prices of $94.2 per barrel in 2019, a cost pressure that might take some of the steam off the growth momentum.
The US dollar made significant gains in 2009 but resumes its real depreciation over the rest of the decade against the currencies of Australia, the EU, New Zealand, and Argentina.
Many Asian currencies appreciate in real terms against the US dollar, with China experiencing especially large real appreciations.
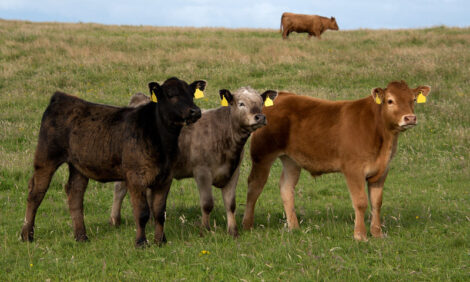
Meat, Livestock and Dairy
Driven by income growth, per capita meat consumption is increasing by 6.1 kg in the next decade, representing a 1.3 per cent annual increase. Meat consumption will reach 54.5 kg per person per year by 2019. Pork consumption has the highest share in the consumption basket, growing the fastest among the three meats at 1.6 per cent annually.
Sanitary/phytosanitary and food safety concerns stemming from disease outbreaks and from traceability issues continued to affect the world meat market.
Recovery in the global economic situation is pushing livestock and poultry prices relatively higher over the projection period.
While recovery from the economic recession in 2009 continues, income and population growth raises per capita meat consumption and fuels expansion in world trade.
Meat trade is projected to increase by 22.5 per cent, reaching 20.5 mmt in 2019.


In the US domestic and export demand for meat and dairy products was severely affected by lower incomes and higher unemployment rates in 2009.
Meat consumption and exports declined and prices for livestock, poultry, and milk fell.
The outlook for 2010 and beyond depends on the strength of the economic recovery. If incomes increase and consumer confidence returns, demand for meat and dairy products will strengthen.
Meanwhile, livestock producers have scaled back production in response to the large losses many experienced in 2008 and 2009. The combination of stronger demand and limited supplies should result in at least some price recovery in 2010.
Despite declining cattle numbers and beef production, cattle prices in the US fell sharply in 2009 because of very weak demand.
Higher feed costs in 2008 and weak demand in 2009 contributed to two straight years of large economic losses to US pork producers.
In the poultry sector, low returns resulted in a sharp decline in broiler production in 2009, the first decline in decades.
A recovery in demand, coupled with strong grain prices, keeps all meat prices relatively high over the next decade. Brazil and the US gain significant shares in the world meat market.
Dairy prices declined significantly in 2008/09 as a result of economic recession. They will increase in 2010 because of economic recovery.
Strong demand and growing incomes will boost world milk production. Over the next decade, world milk production will increase by 23.7 per cent.
In the long run, growth in population and incomes continues to put upward pressure on dairy prices.
Australia, New Zealand, and the EU remain the big exporters. While exports from the EU stagnate, Argentina and Brazil expand their dairy exports.
Crops
In the outlook for sugar, because of the production shortfall in 2009/10, particularly in India, the world price of sugar increases by almost 60 per cent.
The price declines by 26 per cent, to 19.0¢/lb, in the following year as countries recover. However, it continues to remain high and reaches 20.4¢/lb by the end of the projection period, as more sugarcane is used for ethanol in Brazil, and sugar imports of countries like China and the EU remain strong.
With the exception of sorghum, world grain prices are lower in 2009/10 because of the higher supply in world markets.
Wheat and barley prices are projected to decrease further in 2010/11, with the largest decline seen in the wheat price, followed by the barley price. Corn and sorghum prices are projected to increase in 2010/11. Grain prices increase steadily over the next 10 years because of growing demand forfood, feed, and fuel purposes.
The world wheat price dropped to $216 in 2009/10 because of the larger crop production in key wheat importing countries, which lowered import demand.
After downward pressure from high carryover stocks in 2010/11, the price strengthens and reaches $222.7 per mt at the end of the decade.
With strong competition from Russia and Ukraine, the US is losing market share in the world wheat market.
US net exports of wheat are projected to decline over the next decade.
The world corn price decreased to $162.9 per mt in 2009/10.
It is projected to increase in 2010/11 to $168.3 per mt and reach $175.6 per mt in 2019/20.
Argentina is regaining its market share while Brazil loses its market share.

The world barley price is declining in 2009/10 to $135 with lower import demand in world markets. It is projected to decline further, to $131.9, in 2010/11 and to reach $148 in 2019/20.
World prices of oilseeds remain relatively stable in 2009/10 as the supply rebound (especially for soybeans) is met with increased demand because of the economic recovery. Vegetable oils lead the oilseeds complex, as demand from both food and biodiesel uses expands firmly over the outlook period.
While Asian countries, and in particular China and India, underpin much of the food demand growth, consumption mandates in the EU, Argentina, Brazil, and the US strongly expand the usage for biodiesel production.
Increased demand for protein meal from the growing and intensifying livestock sector in Asia supports the price of meal against the backdrop of large supplies owing to strong oil-driven crush and relatively stable demand for this commodity from developed countries.
International rice prices weaken in 2009/10 as more exportable supplies became available, even as major rice exporting countries like India, Egypt, Pakistan, China, and Thailand maintain export restrictions and stock controls.
Biofuels
Bioenergy mandates continue to be key drivers in the current outlook.
Major energy policies included in the baseline are the US Energy Independence and Security Act (EISA) of 2007, the Renewable Energy Directive of the EU, fuel mandates and regulations for Argentina and Brazil, and producer incentives in Canada. In addition, new provisions in the Food, Conservation, and Energy Act of 2008—the 2008 farm bill—are included in this baseline.
Provisions set to expire under both this farm bill and the EISA are assumed to continue throughout the baseline.
Another policy change affecting trade in biofuels is the imposition by the EU of anti-dumping and countervailing duties on biodiesel (blends B20 and above) of US origin.
In the world ethanol market, the 37 per cent drop in crude oil prices in 2009 as well as the 60 per cent reduction in US ethanol net imports contribute to an eight per cent decline in the world price of ethanol.
The ethanol price is projected to remain relatively stable in 2010 before declining by nine per cent in 2011.
The price of ethanol increases over the rest of the projection period as a result of increased demand brought about by US biofuel mandates.
US ethanol imports are expected to come mainly from Brazil, which continues to increase the share of sugarcane production going into ethanol.
World net trade will increase over the decade, approaching 4.2 billion gallons.
Mandates also drive demand for biodiesel in the EU and the Americas and raise net trade to 602 million gallons as well as pushing the world price to $5.58 per gallon.


Further Reading
| - | You can view the full report by clicking here. |