Quality Grades: Why The Recent Upswing
This paper by Larry Corah and Mark McCully explores the reasons for the unprecedented 7.5-percentage-point shift in carcase grades between 2007 and 2009. Distillers grain byproducts and genetics play major roles. 10 January 2010
 6 minute read
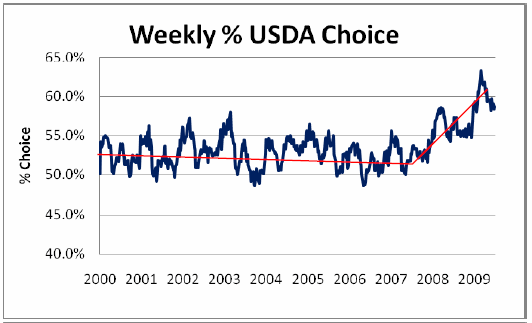
Barely half of fed cattle graded Choice in 2005, scarcity that supported a record Choice/Select spread of $15.35 per hundredweight (cwt.) for 2006.
Then, as if shaking off the depression, grades headed higher. For the first half of 2006, the ratio of Choice cattle edged up to average 51.7 per cent; by July 2007, another percentage-point (ppt) jump in the Choice share foreshadowed greater movement.
After decades in the doldrums, a sea change hit quality grades in late 2007 (Figure 1). By July 2009, 60.1 per cent of federally graded cattle for the year had graded Choice. It was a 7.5-ppt shift in only two years. Why?
Figure 1
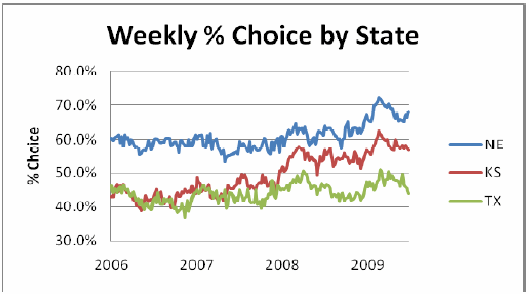
First, let’s better understand where and how much. Although most packers show increases, the biggest were for cattle harvested in Kansas and Nebraska plants. In those two years, percent Choice shot up 13.6 points in Kansas and 10.2 in Nebraska, compared to just 3.9 in Texas plants.
Zooming in on Kansas-harvested cattle in early 2008 (Figure 2), the Choice share increased by 9.6 ppt in a year. For all of 2008, the average weekly Choice grade in Kansas increased 8.4 ppt over 2007. As a second wave in early 2009, the national share of Choice cattle jumped another 3.5 ppt and spiked to 63.2 per cent Choice one week in late February, unheard of since the early 1990s. Nebraska and Kansas have led 2009, increasing Choice by 6.6 ppt and 4 ppt, respectively, while Texas stabilised.
Figure 2
The 15.5 per cent increase in Choice supply was only about half of the hike in Prime beef, running at 2.9 per cent in 2009. The acceptance rate for the Certified Angus Beef ® (CAB®) brand, after a low in 2006 of 14 per cent, will beat 19.5 per cent for fiscal 2009, nearly a 40 per cent increase in three years. No more than 1.8 points of that increase can be linked to the January 2007 CAB specifications adjustment.
These trends are remarkable, especially considering economic conditions in feeding that led to aggressive use of growth implants and repartitioning agents now used by nearly half of all feedlots. While beta-I agonists are benign, the beta-II agonists can reduce marbling by 10 to 40 units.
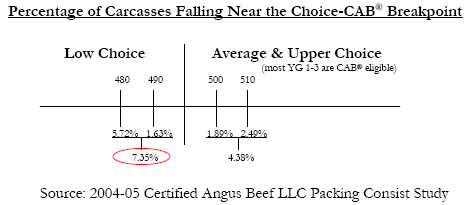
That may not seem like much, but a disproportionate share of cattle have marbling scores close to each grading line. Research shows that moving from Slight-80 to Small-0 results in a change of 5.71 per cent more cattle grading Choice. Higher up the ladder, a 20-unit change results in 7.35 per cent more premium Choice or CAB. (Figure 3).
Figure 3
The epicentre of this grading tsunami is the Central Plains, so let’s look at what else is going on there: distillers byproducts had figured their way into 82.5 per cent of rations at 16.5 per cent of dry matter (DM) by 2007. When that ingredient proliferated a few years ago, studies showed a negative impact on quality grade.
More research confirmed that only at greater than 40 per cent DM, and uncovered a positive counter-effect. Feeding distillers byproducts at 20 per cent to 30 per cent DM resulted in 14 to 15 ppt more Choice grades in a recent study. Other recent work showed these byproducts stimulate up to one-third more starter-ration intake, partially associated with how often cattle eat. Put it all together and the once-suspect byproducts may account for most of the uptrend in Choice grading cattle.
Higher DM intake, better calf health and higher daily gains support higher quality grades. Moreover, herd liquidation has boosted the heifer share of the harvest mix, its current 37.4 per cent being two or three ppt above normal. Heifers often grade nine to ten ppt better than steers.
Positive genetic change can lift old limits on quality grade. The marbling EPD (expected progeny difference) for Angus bulls moved up 7 points since 2004. It only moved up 9 points in the first 25 years of EPD existence, then up 15 points in the last 12 years, representing a 15-point increase in progeny marbling scores. The past decade has seen a steady increase in the relative share of Angus bull use, too, from 39 per cent of all bulls in 1995 to 55 per cent in 2008, and nearly 70 per cent of commercial cows are now called “primarily Angus.” Iowa futurity data show only 52.7 per cent of calves with less than 25 per cent Angus genetics graded Choice.
Those with 75 per cent or more Angus genetics went 86.2 per cent Choice and Prime. The CAB® acceptance rate nearly quadruples with greater Angus heritage. That may explain why the share of cattle with black hides has increased to 60 per cent from its 48 per cent when USDA began reporting it in 2000. From then through 2007, there was a 1-ppt annual increase in black-hided cattle, but since 2007 that increase has been 2.5 ppt per year. The change is most pronounced in the Central Plains.
A few factors are often noted, but their true impacts are unknown. The most popular explanation is a purported change in the marbling level that USDA graders now accept as Choice. Instrument-grading camera data collected by packers refute that, leaving the mystery of a Kansas 9.6-ppt Choice boost in the first half of 2008, triple the increase anywhere else.
Compositional endpoint is another ambiguous item. Older, heavier, fatter cattle should grade better, but from 2006 to 2008, USDA data show leaner Yield Grades. Feeding conditions have been excellent for most of the Plains, and perhaps the heavier, increasingly Angus-influenced cattle have been allowed to express more of their marbling potential.
Sidebar: Quality grade future trends
Eight meat scientists contributing to the paper. They conclude that quality grades may decline somewhat, but identified factors will keep the Choice and Prime levels above the 2006 mark. Here are the factors involved:
The Positives
- Genetics – Angus will continue as the favourite, with 70 per cent black-hided cattle by 2015.
- Early marbling differentiation is a new area of study that can guide supportive intervention.
- Extensive use of distillers grains will continue but generally at less than 40 per cent DM.
- Short term, corn prices favor current feeding programmes.
- Corn prices long term may pose a challenge.
- Percentage of heifers in the mix will decline.
- Positive feeding conditions may not persist.
- Flat economic premiums for quality cattle do not encourage a focus on marbling.
- Continued aggressive use of growth technologies may sidetrack genetic potential.
Instrument grading may have an impact on percentages of quality grades in the consist.
Bottom Line – If quality grades do not decline within a year, it could mean the infusion of higher-marbling genetics has had a lasting effect. Coupled with the smaller cattle numbers, consumer demand in a recovering economy will likely drive the Choice-Select spread to higher levels.