

Understanding Meat Exports
Exports of livestock and poultry products have allowed US producers to grow their businesses beyond what was possible if only serving the US market. John Lawrence, Iowa Farm Outlook, Department of Economics, explains how this has happened. This article was previously published in the Iowa Farm Outlook.The pork, poultry and even dairy sector have benefited significantly in recent months from expanded exports. Beef producers continue to rebuild exports following the December 2003 discovery of BSE in the US.
Trade is a two-way street. The US imports as well as exports meat, dairy and poultry products but in varying degrees. Through the first six months of 2008, the US exported $7.87 billion of animal products (Table 1) and imported $3.76 billion. Beef is the only sector that is a net importer on a volume and value basis, but that could change by the end of 2008. Through the first six months of 2008, the dollar amount of beef imports were down 15% and exports were up 38% and US exports totaled 81% of the value of imports. In 2007 it was 61%.
Table 1. Animal Product Trade Data, $1000 of Imports and Exports

Trade is also a two-edged sword. Opportunities grow for US producers as exports grow, but there is also increased risk exposure if trade is suddenly disrupted. Consider beef trade in 2003 when Canadian imports were halted for three months then US exports stopped and then slowly rebuilt beginning in 2004. Cattle prices reached record highs of $112 in mid-October 2003 and then were as low as $75 the first week of January. Monthly broiler exports to Russia dropped from 224 million pounds in January 2002 to 14 million pounds in April 2002. This decline in export volume backed up export channels and added to the US supply, depressing the price of chicken and also pork, beef and turkey.
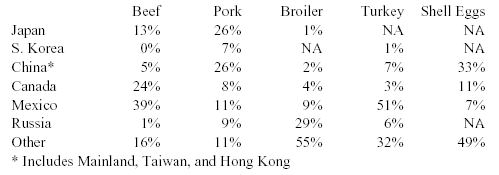
Through the first half of 2008 each of the commodities have a large market or two that takes a majority of the product (Table 2). Sixty-three percent of US beef is exported to neighboring Canada and Mexico. China is an emerging market for pork and is now equal to Japan in volume. Over half of broiler exports go to a large number of smaller markets. About half of turkey goes to Mexico and Hong Kong is the largest single market for shell eggs.
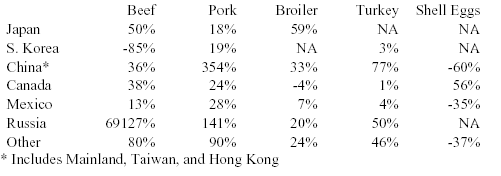
Of major concern to the current market is trade with Russia who announced August 27 that it planned to lower its import quotas for poultry and pork. That is a particular risk for broilers, but also beef, pork and turkey that have seen significant growth in Russia this year (Table 3). If imports to any of the commodities to Russia are reduced the price impact in the US may be felt in the other commodities as well.
Table 2. Share of US Export Volume to Selected Countries, First Half 2008.

Table 3. Percentage Change is US Export Volume by Country,
First Half 2008 v. First Half 2007

Consumer Impact
While there has been a lot of discussion about the impact of higher feed costs on food prices, the production of meat and milk has increased thus far in 2008. However, the supply of these products available to domestic consumers is a different story (Table 4). Export customers, in some cases, have outbid domestic consumers for animal products reducing the domestic supply. In all cases, the amount of imported products has declined. While production of all four commodities increased, turkey is the only meat to show an increase in retail consumption. The poultry meats also posted increases to their cold storage at the end of June.
Table 4. Percentage Change in Production, Stocks, Trade, and Per capita
Consumption
of Beef, Pork, Chicken and Turkey, First Half 2008 v. First Half 2007.

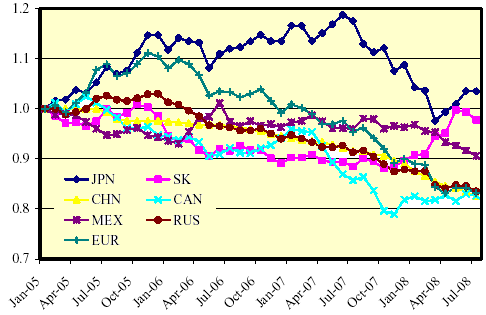
One of the driving forces behind the change in imports and exports is the strength of the US dollar relative to trading partners. A lower priced dollar makes imports more expensive and exports cheaper relative to other goods. With the exception of Japan, the US dollar is weaker than it was in 2005 compare to selected trading partners in Figure 1. In July 2008 compared to January 2005 the US dollar was approximately 15% cheaper in Canada, Russia, China, and Europe, 10% less in Mexico and 5% lower in South Korea.
Figure 1. Index of $US Value Relative to Selected Currencies, 1/1/05 = 1

How does currency value impact trade? Consider a box of US meat valued at $100 in the US. In January 2005 it would have taken 827.62 Chinese Renminbi to buy it. In July 2008 currency value it would take only 683.62. Thus, with the same amount to spend Chinese consumers can by more US meat.
On the opposite side, if US consumers wanted to spend $100 on Canadian meat imported to this country they will receive less than before. In July 2008, the $100 US will but 101.27 Canadian dollars worth of product. If the currency were valued at January 2005 levels it would buy 122.53 Canadian dollars worth of product.
Implications for farmers
Trade has been beneficial for US livestock and poultry producers. The weaker US dollar and brokered trade agreements have helped expand US products into markets around the world. While exports have increased opportunities, it has also increased risks. First, because trade is a two way street, imports come into the country and compete with domestically produced products. Second, and more importantly, domestic prices are impacted by factors that impact trade such as policy changes in customer and competitor countries, governmental disagreements that disrupt established trade, disease concerns and rules, currency, energy prices, and other issues outside agriculture. These factors are beyond our control often change faster than farmers can adjust.
What farmers can do is recognize the new opportunities and risks that they now face. Price risk management will be key for success in agriculture that is increasingly dependent on trade.


